Posts

Showing posts from 2011

Trust Bank Singapore, New Digital Bank Freebies!

Image
Have you applied for your Savings Account or Credit Card with Trust Bank Singapore, Singapore's digital bank backed by a unique partnership between Standard Chartered Bank, and FairPrice Group? REFERRAL CODE: BZACYE0F ( it is a number zero, not letter ) Get $35 worth of free Fairprice vouchers and other freebies by just Downloading the Trust App and Open a Savings Account online with the App, simple/easy within 10mins!: Get free $10 Fairprice E-voucher (no minimum spend at stores/online) by entering this code ( BZACYE0F ) when apply for the Savings Account. Get free 1kg Fairprice Rice voucher Get free Kopitiam Breakfast Toast Set voucher Charge one transaction to your debit card to get free Fairprice $25 voucher (no minimum spend, at stores/online). Hack: Do a funds transfer of $1 or $10 from your own bank to Trustbank savings account. Then Just add your debit card number to Grab App, authenticate with $1 charge/refunded to your saving

Stock Market Forecast January 2012

Image
Hmmm.... as I suspected, when the 'nasty planet' reached it's position, it created a Market Top. So when will markets start to drop? Shanghai Composite Index seems to be most sensitive to these planets. My "STI Open Book" do not have data for Dec 27/28 2011. But it indicates a drop from Dec 29 2011. As I mentioned before, my "STI Open Book" is accurate for forecasting major tops and bottoms (longer term), not to be used for short term forecasting. However, if done correctly, it can be accurate for short term forecasting also, but requires alot of manual analysis. Yes, alot of work that I'm almost burnt out the past 3 days doing the detailed day-to-day analysis, and still doing in a slower pace. "A Picture is worth a thousand words" Oops! 3 pictures of DOW, S&P500 and Straits Times Index Wave Count pointing to the next major move ahead!

Season's Greetings from TSK

Image
MERRY CHRISTMAS & HAPPY NEW YEAR 2 0 1 2

Panic Crash Cycle Planetary Effects Activated?

Wow! This morning when I saw Aussie Index dropping more than 2 percent, immediate reaction was have the Planets reach their respective positions? Looks like the Planetary Formation in the sky is almost complete for the Panic Crash this week! But I know one "nasty planet" should reach its position by Dec 20-22 2011. Then I just read Earth already reached its position. Be careful. This Panic Crash Cycle might extend into January 2012! And might come back again in 2012, if my research and understanding of this Panic Crash Cycle cause by this Planetary Formation is correct.

Shanghai Composite Index Broke Longterm Support!

Wow! Today, December 12 2011, Shanghai Composite Index broke and closed below its Long Term Support dating back to 2005! Looks like Shanghai Composite Index is the most sensitive to Planetary Formations in the Sky! Who will be next? Hang Seng Index? Dow Jones Industrial Average? Will the Stock Market Crash I've been waiting for finally start, or is it still waiting for some planets to reach their positions to complete the Pattern in the Sky?

Rare Lunar Eclipse Dec 2011 Stock Market Crash?

Image
I wanted to post this last night but was down with a bad throat infection. Luckily I'm feeling better now with some self-medication. Wow! My Forecast of December 2011 Stock Market Crash starting from Dec 7 2011 becoming a reality? Yes, tho one day early! Oops! Still early to confirm? On December 10 2011, there will be a "rare" Lunar Eclipse. According to Tim Bost, market astrologer, this Lunar Eclipse is considered rare because it occurs on the same day Uranus turn direct. The last time this happened was in November 2003. Guess what happened to DOW then? Markets started to decline before the Lunar Eclipse and continued to drop for a few weeks. Will history repeat? My Stock Market Time Clocks and Forecasting Methods using WD Gann's Secret Forecasting Method tell me there is a high probability. A Picture is worth a thousand words! Be Careful. Dun try to pick bottom or catch the falling knives! Supports could be broken easily, especially when Mercury is retrogra

Stock Market Secret Cycle Time December Crash?

Image
Wow! I just found the " Stock Market Secret Time Cycle " that timed many important market tops and bottoms, including Stock Market Crash! This "Secret Time Cycle" gave the timing for DOW top on May 2 2011, Oct 2007 (+/- 2 days), bottom on Oct 2002 (+/- 2 days), Mar 9 2009 (+/- 2 days). It also gave dates of Stock Market Crash - August 2 2011 to Oct 4 2011, Flash Crash on May 6 2010. And many more. Hmmm... there is a high probability this "Secret Time Cycle" will give me the date of this Bear Market Bottom, plus dates of future Bull and Bear Markets. I'm still working on the research. So what's the next turning point? This "Secret Time Cycle" give me December 6/7 2011. Do you know what happened on December 7 1941, exactly 70 years ago? Yes, Pearl Harbour Attack during World War 2! Hmmm... what could happen on December 7 2011? Another Stock Market Crash? Can you remember what is the Forecast for December 7 2011-Jan 5 2012 in the CLSA

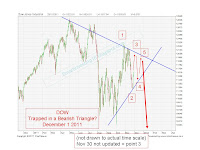
DOW & STI Trapped in Bearish Triangle

Image
Wow! It could be a larger Bearish Triangle in the making? My "STI Open Book" showed many "turns". So it could be pointing to a Bearish Triangle before the Panic Crash comes! Expect a fast turn of events? Be careful. A Picture is worth a Thousand Words. Oops, 2

Shanghai Composite Leading Next Leg Down!

Wow! Its Shanghai Composite Index Again! It is feeling the effects of the "Planetary Formation" in the Sky now, down more than 3% so far today (it is still trading 2.16pm)! Or is it because of a Sell Call on China Stocks issued by Goldman Sachs November 29 2011? Hang Seng Index is following! Will DOW be next tonight? Watch!

STI Megaphone Top Update

Image
Wow! Do you remember when I first warn about STI's Bearish Megaphone Top - Danger Ahead? I forgot about it and never follow up or monitor! S---! Here is the updated chart of the STI Megaphone Top. "A Picture is worth a thousand words" Are you still trying to pick bottom or "catch the falling knives"? Watch the Strong Daily Down-Trend Channel! Unless STI can breakout and close above the strong resistance lines, you are catching the falling knives! Beware of false breakouts!

Stock Market Forecast December 2011 (Panic Crash Ahead)

Haha, if you have been reading my recent articles, you already know the Stock Market Forecast for December 2011. WD Gann said "Forewarned is Forearmed"! That's the benefit of Stock Market Forecasting using "the right methods" = the WD Gann Secrets of Stock Market Forecasting! Time is the Most Important Factor! So have you read my recent articles which are still in play: 1. Stock Market Forecast October -November 2011 . The waves have extended to December 2011. 2. DOW Megaphone Bottom 1987 Like Panic Crash 3. Panic Crash Cycle Ahead 4. DOW's Black Swan Dive Ahead 5. STI Falling 3 Peaks History Repeats . Downside Target Might be worst! Today, "chng-kay" seems to be holding STI at the neckline (2677) since opening (more than 2 hours already). How long can they continue to hold it? Let go and STI will dive!

STI Falling 3 Peaks - History Repeats?

Image
A picture is worth a thousand words! Did you notice the Straits Times Index has a Falling 3 Peaks Pattern? Falling 3 Peaks Pattern is also found in the Hang Seng Index, S&P, Nasdaq, etc. Hang Seng Index broke/close decisively below the lowest of the 3 Peaks' valley, you saw what happened? Did DOW, S&P500 and Nasdaq break/close below the lowest valley last night? Watch for Straits Times Index to break and close below 2754, the lowest of the 3 Peaks' valley, then see what will happen? Watch the Possible Repeating Pattern? History Repeats?

Shanghai & Hang Seng Index Leading the Crash?

"Lai Liao Lai Liao"? Is Shanghai Composite Index leading the Crash? Hang Seng Index is following already? Did you hear any news? Its the USD rally? Is DOW next tonight? The signal is in the SKY!

Looking Back 20 Years - DOW Dive 3.9%

What happened today in History? DOW dived 3.9% on November 15 1991. What happened? Will history repeat?

DOW's Black Swan Dive Ahead?

Image
Haha! There you go again! Forgot to put the pieces of jigzaw puzzle together again! Last night, I decided to input the November 11 1918 date into my Stock Market Time Clocks. Bingo! It gave one of the most important date in DOW's history: July 8 1932! Let's do a 4-D bet! Haha! (Do you know what 4-D stand for: Debt, Deficit, Default, Downgrade!, haha). The Maths for November 11 1918 to November 11 2011 I shared yesterday is indicating a possible end of cycle. So it should be a TOP in DOW! Last night, I was staring at the DOW 60 minute chart. I saw this pattern and decided to draw a trend line. This morning I checked. True enough, it hit the trend line and continued to trend below it till closing, in every time frame. What was that pattern? Its a possible completion of Triangle Pattern! Look at the DOW Chart below. Does it look like a Black Swan Formation? What does a Black Swan do? BLACK SWAN DIVE! A picture is worth a thousand words! What could happen over this wee

November 11 2011 Stock Market Crash?

Last night, I was searching the internet for some information and found this: November 11 1918, end of World War I. Wow! That is exactly 93 years ago from today, November 11 2011! Today, I suddenly have this "Food for Thought", just thinking out loud: 1. 80+13 = 93, wow! 13 year cycle? 2. 18.6x5 = 93, wow! 18.6 year cycle? 3. 19x4 + 17 = 93, wow! 17 year cycle? 4. 5x666 = 93, wow! 666 day cycle? Wow! What could happen today? Will LAO TA (Mr DOW) kick off Wave 3 of 3 of 3? KILLER WAVE! Today, Straits Times Index seems to be floating at Wave 2 of 3 of 3, waiting for Hang Seng Index to pull the trigger? Haha, this is not part of my forecast, but will be incorporated if it works! Lookout for my next interesting article: "How to forecast the future direction of Hang Seng Index, DOW and Straits Times Index using the Shanghai Composite Index as Crystal Ball! "

History Repeats - STI Double Top Warning?

Image
Haha, sometimes it does not help to do double confirmation? Analysis Paralysis? The more research I do, the more confuse I get? No No No! It is because I failed to piece together the jigzaw puzzles. I'm overwhelmed by each piece of research, overjoyed when I discover the secret of each piece, then failed to merged the pieces together for the final results. But the best piece is still my "Straits Times Open Book". But it is a "Long Term forecasting model ", although it had been quite accurate short term. So what does it tell? "Watch for a possible double top November 9-11, that should end this rally and start the next major decline."

Panic Crash Cycle Ahead?

Be careful! There is a potential Head & Shoulder Forming in the 10-min Charts of DOW and Straits Times Index. If the decline from OCt 28/31 Top is wave 1 down and yesterday's strong rally wave 2 up, should markets drop today, that could be start of wave 3 down. Should the right shoulder of the H&S pattern complete and the neckline is broken, haha, guess what will happen? I updated my Stock Market Time Clocks late last night, with important dates from my research of the past 30 plus years of data from Watching the Sky for Trends. Wow! Most important discovery of all time. I'm still working on it. Guess what will happen November 4? Another "Black Day" in Stock Market History? Let's watch. This is the first time I'm using this formula. I keep my fingers crossed! I'll share more if it occurs.

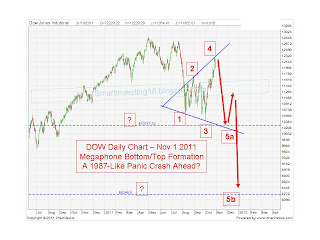
DOW Megaphone Bottom 1987-Like Panic Crash?

Image
Did you notice this Bearish Pattern Formation in the DOW Chart? A Megaphone Bottom or Top! According to experts, you can project the target downside or upside (if you are bullish) using a simple formula. I'm bearish. Using the formula, measure the difference between points 4 and 5a, then subtract this difference from point 5a = projected target downside 5b. Wow! Can you see what is my projected number for DOW? But first we need to wait for the pattern to complete at 5a to get the actual number. Wow! My additional deep research into the past 30 plus years of data "Watching the Sky for Trends" indicates a possible Panic Crash Like Pattern of 1987! Another Flash Crash? A Waterfall, Sharp Decline Ahead? Provided my calculations are correct and my interpretation of the formula is correct! This is the first time I'm attempting to forecast using this formula! According to WD Gann, Time is the Most Important . When Time is Up, Prices will Fall or Rise! (Note:Chart

Major Turning Point Ahead DOW/STI

Wow! Did you notice this pattern of Major Market Sell-off dates for DOW and Straits Times Index since DOW Top out on May 2 2011? DOW - May 2, June 1, July 22, Sept 1, Sept 28 STI - June 2, Aug 1, Sept 1, Sept 27/28 So is a major turning point ahead - Oct 27/28 to Nov 2? Yesterday I got an indication that the rally wave for STI is almost finished. I should have been patient to wait for this confirmation before issuing warning of the crash ahead. But my other indicators have not confirmed yesteday's move. Be careful, it is likely to end Oct 28 or 31 2011! Be patient, wait for confirmation, the next sell-off could be BIG! DOW is likely to kickoff its "Killer Wave", Wave 3, after Wave 2 rally ends! Guess what will happen to the rest of the World Markets? Haha, hope this time I'm right, with deep research into the final bottom of this bear market, then working backwards to today! Plus watching the "Sky for Trends" for confirmat

$50 Bonus Cash for CIMBK Savings Account

Wow! I heard but did not believe as I cannot find the information at CIMB Bank Website and forgot about it. This morning I was at the CIMB Bank Branch. I saw the Bonus Cash Promotion flashed on TV. So decided to check with the Bank Staff. Wow! New customers, just open CIMB Savings/Current Account, the Bank will give you $20 Bonus Cash. Top up your account with $50k, the Bank will give you another $30. You only need to maintain the $50k until end October 31 2011 to qualify. Promotion ends October 31 2011. Wow! Want to make more money? Just tell the staff my Name/NRIC, I will get $30 shopping voucher as referral. Haha, we can share the vouchers! Haha! I gonna ask my family members to Open Accounts with CIMB! They make money, I also make money! Huat ah!

Potential Big Crash Ahead???

Do you trust a Lady's Instinct? I just did a quick review late last night, dun have time to post details for you. Dun have time to do a double confirmation. DOW might have topped out last night, there is a potential H&S in the 1min chart. Based on a "secret pattern" I discovered last night, STI and HSI might top out today, DOW last night. Yes, this big rally might be over soon. What's next? This is what I read (not sure how reliable) but worth noting, sure does coincide with my Elliott Wave Count?? : "Watch for a bailout followed by massive market manipulation next week... followed by a total collapse. " Stock markets are being pumped up by the banksters to hide the truth and to support the world's financial system a bit longer...but it will fail. After this comes the " total collapse ". A potential big crash coming? "Wave 5 equal Wave 1"? Be careful.

Stock Market Forecast October-November 2011 (Crash Part 3)

Image
Wow! I'm taking the risk of putting out my Stock Market Forecast for October -November 2011 before receiving any confirmation from my various sifus! Based on my Stock Market Time Clocks and Straits Times Index "Open Book", below is the Stock Market Forecast for October - November 2011! "A picture is worth a thousand words!" Stay tuned for updates should it differ from my sifus (which I doubt, haha!). But I will definitely update should my Wave Count change. Good Luck!

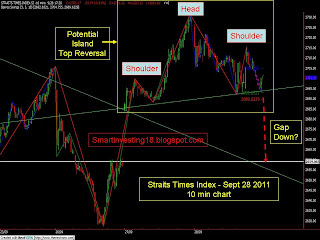
STI Potential H&S Pattern Sept 28 2011

Image
A picture is worth a thousand words! What could happen to DOW tonight to trigger a potential gap down tomorrow in Straits Times Index? Or will it trigger a potential inverse Head & Shoulder Pattern in the Straits Times, ie continued rally? Stay tuned for Stock Market Forecast - October 2011. Will there be a major crash or major rally?

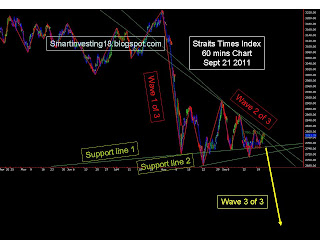
STI & Dow Wave Count - Crash Ahead?

Image
Looks like the "Killer Wave", Wave 3 of 3, had started with the Hang Seng Index? When will the "Killer Wave" attack Straits Times Index? Looks like Straits Times Index is completing Wave 2 of 3 Triangle. If my wave count is correct, when either support line 1 or support line 2 breaks, then next is the "Killer Wave" . Will DOW help to kick off the "Killer Wave" tonight?

NTUC Fairprice Shares Pay 6% Dividend 2011

Wow! I just received my NTUC Fairprice Share Dividend and Rebate Notice. "More Rewards for You This Year!" "A patronage rebate of 4.5% and a 6% dividend will be automatically credited in your bank account." Wow! That's for financial year ended March 2011, a 5% plus 1% special dividend and a 4% plus 0.5% special rebate!

Stock Market Forecast September 2011 -Crash Part 2?

Wow! Did Stock Markets around the World crash in August 2011 as I forecasted in "Stock Market Forecast August 2011 - Crash Ahead?" Isn't it amazing that I can use Straits Times Index to forecast the direction of Global Stock Markets, including "Lao Ta" (chinese for big brother DOW). I was shocked on the accuracy of the formula I used to forecast, the first time I used it upon discovery days before the forecast was issued. Wow! Thanks to W.D. Gann! Thanks to my Stock Market Time Clocks! Thanks to the Stock Market Secrets that I managed to decipher! Did Stock Markets crash in August 2011? Oops! Yes and No. Subsequent to my August 2011 Forecast, I have done additional research and discovered the formula was very accurate even for forecasting past crashes and can be used to forecast Bear Market Bottoms! Haha, so I'll not be disclosing it here, as W.D. Gann said " In silence, with silence are all things made"

SIMSCI "Flash Crash" August 18 2011

Image
Wow! Did you notice the "Flash Crash" in SIMSCI today? Around 11.45am, SIMSCI "crashed" from around 330 to 326! As of this writing, it is still hovering around 326.85. Straits Times Index did not drop when SIMSCI did the "Flash Crash". Did you make "tons" of money if you bought the SIMSCI put warrant? NO! Market maker "cheated"! Before the "Flash Crash" you can buy the put warrant at around 0.430, at the "bottom" of the crash, you can only sell your put warrant at around 0.450. Wow! Cheated. Market maker owe us an explanation!!!!! What happened to SIMSCI? Is this a "warning" of the start of the next "Crash" leg down????? (SIMSCI equivalent to MSCI Singapore)

Stock Market Forecast August 2011 - Crash Ahead?

Have you read and analysed the following 3 articles which I posted recently? 1. Straits Times Index Diamond Top Formation 2. Straits Times Index & Dow Forecast 2H2011 3. Dow 3Peaks Domed House Pattern Update Did you notice Straits Times Index (STI) hit the Top of the Bigger Diamond Top Pattern yesterday? Did you notice the "false breakout" of the Triangle Pattern? According to "experts" of Triangle Patterns, the last wave usually 'breakout' of the Triangle Pattern? Be cautious! Is it the last wave up of Wave 2 Triangle Pattern? Watch for the break of support! In the past few days, I updated my Stock Market Time Clocks. Guess what I discovered? July 27/28 2011 an important turn date! Will Stock Markets Crash in August 2011? I will share more should the Crash occur, how I managed to calculate and forecast this coming crash! Watch!

USA Headed for Second Recession?

Image
Are we headed for a Second Recession? Per article posted by Streettalklive, the following indicators show high likelihood: 1. Chicago Fed National Activity Index - a small step to crossing the 35 mark, which has always been a pre-cursor to recession. 2. Graph of Real GDP Growth - shows downward growth heading to below 2% line, which has been indicator of a recession in the past. Almost every drop below this line has led to a recession since 1947.

Straits Times Index Diamond Top Formation?

Image
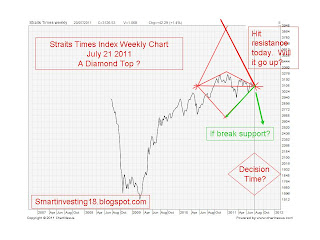
Did you notice this Bearish Top Pattern forming in the Straits Times Index? A DIAMOND TOP! Yes, it is drawn to "special measurements". So where do you think Straits Times Index will be heading tomorrow? Where will it be heading when "Decision Time" comes? Watch!

Straits Times Index & DOW Forecast 2H2011

Image
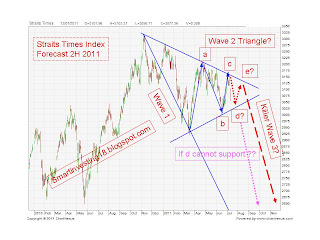
A regular blog visitor asked me for the Straits Times Index Wave Count. Oops! I'm not an expert on Elliott Wave! But recently I read an expert talking about DOW's Elliott Wave Count - that DOW is in a Wave 4 Triangle, a bullish view but depends on whether critical support can hold. As I said in an earlier article, Elliott Wave Count is but one of the jigzaw puzzle in forecasting....hmmm....anyway..... I've been starring at this STI Chart Pattern for many months, wondering how it would form. Hmmm.... based on my Stock Market Time Clocks, STI & DOW Open Books, I "guess" this should be pattern and Wave Count: A Picture is worth a thousand words! Watch the support and resistance trend lines! Beware the "Killer Wave 3" ahead!

DOW 3Peaks Domed House Pattern Update

Image
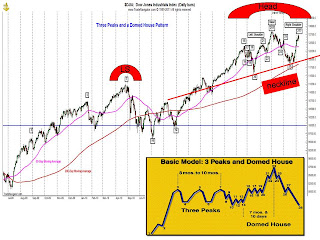
Have you read Stock Trader's Almanac's latest update on DOW's 3 Peaks Domed House Pattern? A picture is worth a thousand words! The picture is taken from STA's update July 8 2011 with a downside target of 10,000 (pt 28) if 11,555 is broken. I superimposed the Basic 3PDH Pattern, added those items in bold red. Can you see the neckline for the "mini Head & Shoulder Pattern"? Are we now at Point 25 or 27? Can you see a potentially bigger Head & Shoulder Pattern? Oops! One Head at a time lah! How long will this take to form? Straits Times Index took sooooo loooong to forming....zzzzzz

Asian Investment Conference 23-24 July 2011

AICE 2011 Asian Investment Conference and Exhibition 23-24 July 2011 Suntec International Convention and Exhibition Centre See Conference Programme Free Admission

DOW & STI Forecast July 2011

Image
So where do you think DOW and Straits Times Index (STI) will be heading in July 2011? Will Regional Indices be heading in the same direction? A picture is worth a thousand words! Oops! 2 pictures: one for DOW and the other for STI! If the forecast is correct, then look for the next forecast in September 2011!

Watch the Sky for Trends

My "sifu" said “market analysts using timing tools such as Fibonacci retracements, Elliott Wave and dynamic cycles are amazed when their projections work out only occassionally. This indicates they only have a piece of the puzzle.” People said W.D. Gann uses planetary time cycles to forecast the market directions. Hmm.... now you know why I keep finding missing pieces of the jigzaw puzzle to improve my Stock Market Time Clocks' forecasts! I tried researching and using planetary time cycles but it is not easy. What I'll do is to confirm and double confirm the turn dates provided by my Stock Market Time Clocks. Yes! I've done it, forecasting the Tops in Straits Times Index on November 9 2010 and DOW on May 2 2011. Next is to double confirm the turn dates for the next Bear Market bottom!

W.D. Gann's Secrets Unveiled - Part 9

W.D. Gann said: "To make a success you must continue to study past records, because the market in the future will be a repetition of the past. If I have the data, I can tell by the study of cycles when a certain event will occur in the future. The limit of future predictions based on exact mathematical law is only restricted by lack of knowledge of correct data on past history to work from." Wow! Finally, I understand the great importance of having years of past historical data for the Indices and Stocks to make more accurate forecasts! Recently I managed to reinstall and reactivate my Metastock Software after it became a “white elephant” when my old computer crashed a few years ago and I decided not to pay for data subscription. Haha, now I know how to obtain free data for Metastock - upload Yahoo Finance for major stock indices, like DOW, S&P500, Shanghai Composite, Hang Seng Index, Kospi, etc. Wow! With so much historical data dating back to 1929 for DOW,

DOW Bear Market Signal – “Killer Waves” Ahead!

Image
Wow! My Stock Market Time Clocks and both “STI and DOW Open Books” were spot on! It forecasted the tops in Straits Times Index (STI) on November 9 2010 and DOW on May 2 2011 and the nasty declines that followed. (read my Crystal Ball Section). Now the “Killer Wave” indicator in the DOW Chart is signalling a possible nasty bear market ahead! Yes! The double top pattern in the Coppock Curve, nicknamed the “Killer Wave” is forming in the DOW Chart. “This double-top pattern has occurred only 7 times in 80 years – with 5 of them accompanying the start of the most notorious bear markets of the Twentieth Century: 1929, 1969, 1973, 2000 and 2007. The average decline (excluding the -86% loss in 1929) was almost -40%! “ DOW typically enters a bear market during the formation of the second peak. Now the second peak (double top) is developing, raising the odds of a nasty bear market ahead! If the U.S. stock market enters a bear market, then global markets will likely experi

DOW Head&Shoulder Pattern Danger Ahead!

Image
Daryl Guppy posted this DOW Chart on June 7 2011 at the CNBC website. A picture is worth a thousand words! DOW Flashes Danger: Target 11,600, he said in another article. The above is just a small Head and Shoulder Pattern of a BIGGER one yet to be formed? Wow! Have you read my DOW May/June 2011 Forecast? Yes! We can forecast the future direction of the market long before it happens! That's the "Power" of W.D. Gann's secret methods which I managed to unveil! I'm still continuing with my research, which I believe there are still missing pieces of the jigzaw puzzle to complete. I just found another piece yesterday and another piece to complete. Stay tuned !

Straits Times Index & DOW Forecast June 2011

Image
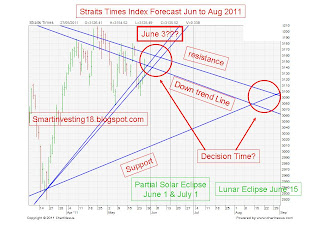
A picture is worth a thousand words! If we can draw trend lines correctly and know how to read the chart patterns, one can forecast the market direction ahead! Here is the June to August 2011 Forecast for Straits Times Index: Here is the June 2011 Forecast for DOW: So where do you think Global Stock Markets are heading?

NTUC Income Shares Pay 8% Dividend 2011

Wow! Just received news that NTUC Income will pay shareholders a dividend of 6% plus a special dividend of 2%, total 8% for financial year 2010. Money will be credited to bank account on May 27 2011. Hurray!

Straits Times Index Secret Time Cycle Unveiled!

Yahoo!!! I have finally found another missing jigzaw puzzle to my Stock Market Time Clocks! I attended a seminar on Saturday and this local TA expert shared his discoveries on Straits Times Index Time Cycle plus many other techniques he used to make massive income from the stock markets. He is also another "expert" on WD Gann forecasting and trading methods. He said if WD Gann spent 10 years full-time on research to perfect his trading methods, should we not spend 1 day or 1 week full-time to research/learn? Wow! Now then I realised the "Real Expert" in Singapore is not "The Joseph Cycle"! Hahaha! I spent more than 2 years full-time researching! Finally, my Stock Market Time Clocks should be 99% accurate. Today, I managed to unveil the local TA expert's secret code for the Straits Times Index Time Cycle. Huat ah! Still more research is required. Now I'm incorporating George Lindsay's Timing Models into the Straits Times Index Time C

Straits Times Index Forecast May 20 to 31 2011

Image
Wow! Did you notice the patterns forming in the Straits Times Index? A Fengshui Master forecast a hard fall from next week! A Financial Astrologer forecast major reversal points for DOW based on major Planetary Alignments next week! So, where will DOW, Straits Times Index and other regional market indices be headed from now?

EWI Global Market Perspective May 2011 Free

Get 100+ Pages of FREE Charts & Analysis for Every Major World Market Until May 31, Elliott Wave International is offering the current issue of Global Market Perspective , free! This global publication covers every major world market, including global stock and interest rate markets, gold, silver, crude oil, and currencies. A $49 value -- it’s FREE until May 31. Download Global Market Perspective NOW. Over the past month, you have witnessed extreme volatility in the metals, crude oil, currencies and global stock markets. Will this volatility continue or is it time for “sell in May and go away”? No matter what happens, it will affect your portfolio and your finances . Answers to these questions and more can be found in Robert Prechter's current issue of Global Market Perspective , a 100+ page book full of investment analysis and forecasts for every major world market. And for a limited time, you can download this important resource FREE! Global Market Perspective includes

Dow May/June 2011 Forecast?

Image
Wow! I'm back to running a marathon against time again! Hahaha! Busy busy with my research again! Few days ago, I found more "George Lindsay" materials and as I've always suspected, it's "Wow"! Amazing! Since I discovered the "Ultimate WD Gann's Secrets" to Stock Market Forecasting, I discovered the "Straits Times Open Book" as well as the "DOW Open Book". However, as from November 9 2010, DOW "refused" to follow the "Open Book", I stopped monitoring. But since May 2 2011, looks like DOW is back into my "DOW Open Book" and both STI and DOW looks like back in sync! If my Elliott Wave counts are correct, looks like STI is starting Wave 3 of 3, while DOW might likely be Wave 3 of 1 down? Would DOW continue to follow my "Open Book"? Let's watch. (Warning: I've not completed my research. Above pattern can invert. Not for day to day forecast, more reliable for major top

Straits Times Index Forecast May 2011

Image
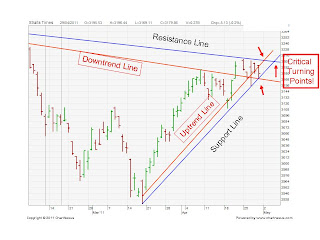
Wow! Did you notice the Straits Times Index Chart is now at a critical juncture? Next Week (May 3-6 2011) is Decision Time! Where will STI Head to next week and in May 2011? Look at the Straits Times Index Chart below! Have you been watching, listening or reading the Singapore Election 2011 Rally News? Today's Headlines posted online : "PAP ministers warn of 'dark clouds' on horizon" Wow! Remember what was written in "The Joseph Cycle" Book? Hmm... where will the market be heading? Can STI forecast also forecast the coming Singapore Election 2011 results on May 7 2011?

DOW 3 Peaks and Domed House Pattern Again!

Image
Remember the 3 Peaks and Domed House Pattern discovered by the late George Lindsay? Remember what is the Mirror Image of the 3 Peaks and Domed House Pattern which I posted in an early article? Yes! The 3 Peaks and Domed House Pattern is forming again in the US Indices, Straits Times Index, Hang Seng Index and other Indices. Stock Trader's Almanac has been tracking this pattern since March 9 2009 major bottom and has just issued the attached DOW 3 Peaks and Domed House Pattern possibly topping anytime now in 2011. My Stock Market Time Clocks show a possible top for Nasdaq on April 28 2011, maybe by next week or another, DOW and S&P500 should top out? Maybe not as there is a major Planetary Alignment on May 1 2011, plus minus a few days. Then we have June 13 2011, the next 8.6 year cycle turn date, discovered by Martin Armstrong. What could happen on this date? Let's watch.

ATIC Singapore (May 7-8 2011) Free Tickets

ATIC Singapore - Asia Trader and Investor Convention is back again. May 7-8 2011 Marina Bay Sands Convention Center Get your 2-Day Entry Ticket (worth S$18) Free here!

Straits Times Index - Expect Sharp Decline Ahead!

Wow! My Straits Times Index "Open Book" had been spot on for the past one month! Normally, it cannot be used reliably for "intermediate" forecast, and not meant for such purpose anyway. But it accurately "forecasted" the bottom on March 18 2011 and the rally todate. Has the current rally ended or completed? Wow! Fasten your seat belts! Expect a Sharp Decline Ahead! A local technical expert recently forecast "A Global Market Selloff Ahead" using his own "proprietory" technical indicators and methods. He analysed Gold, Oil, Currencies, Hang Seng Index, etc charts and arrived at the conclusion! Expect Hang Seng Index to drop 1100 to 1600 points he said. Wow! Are you ready?

Hang Seng Index Danger Ahead?

Image
Today, March 23 2011, Daryl Guppy posted an article titled "Why Hang Seng Could Face Big Losses" at CNBC website. Below is summary of keypoints to note: Decline in regional markets started before the Japanese earthquake. These external events, including the attack on Libya, will accelerate existing trends. Fear drives markets, but when it jumps on an existing down trend, the result is more. Hang Seng's decline started in November 2010 . The move below the long term uptrend trend line confirms this long-term up-trend has ended, but it does not signal the start of a new downtrend. This end of uptrend behavior can develop into consolidation, or a sideways movement prior to a continuation of the uptrend. The failed rally in January 2011 confirmed the second anchor point for the downtrend line. The position of the downtrend line was confirmed with the third failed rally in early March. A strong chart pattern was created = a long-term down sloping triangle, bea

EWI's FreeWeek is Here!

Elliott Wave International has just announced the beginning of their popular commodity FreeWeek event, where non-subscribers can test-drive some of EWI's most popular premium services. Now through noon Wednesday, March 23 (Eastern Time), you'll get access to all of EWI's hottest daily, weekly and monthly opportunities in softs, meats and ags, plus all the charts, world-class analysis, video forecasts along with practical real-world trader lessons, tips, tricks and more! As many of the commodity markets are reaching new highs, the timing of this FreeWeek couldn’t be better. See the opportunities that are unfolding in commodities through the eyes of an EWI subscriber before this rare event expires. Learn more and get instant access to EWI's FreeWeek of commodity forecasts and trading education now -- before the opportunity ends for good. FreeWeek is one of EWI's most popular programs, and it's perfect for traders and investors who are curious about EWI's

Elliot Wave Theorist February 2011 Free!

Announcement: Elliott Wave International has released a free issue of Robert Prechter's Elliott Wave Theorist . It includes more of Robert Prechter's experience than you’ll ever read in a single issue -- all 30-plus years of it. What matters is that he uses his experience at a moment when it can do the most good, namely when investors are most vulnerable . This is a unique opportunity for you to see what Prechter’s subscribers see. Don't miss out! This free issue is only available through March 21. Learn more about Prechter’s 12-page issue – it’s yours for free.

Where KOSPI, STI, HSI, Sensex, Taiex Heading?

Image
Daryl Guppy wrote an article dated February 16 2011 titled “KOSPI shows Trend Failure”. Below a summary of key points to note: Regional markets follow the KOSPI lead; KOSPI moved above 2007 high but unable to hold onto gains. This suggest other markets – Taiwan, Singapore, Hong Kong – may also have difficulty moving above 2007 high; This is a potential end of trend signal; KOSPI, Taiex, HSI, STI all show break of significant uptrend lines – this calls for greater level of caution; KOSPI minor support at 1900. Failure points to downside target near 1720; Expect KOSPI to lead the way and show how markets will recover from this sharp selloff. I have also attached Straits Times Index Chart by Daryl from a prior article dated February 9 2011 – see where are the potential support lines (2980, 2700, 2600). Dun try to catch the falling knives! When time is up, the market will find the "right" bottom!

Elliott Wave Principle Book - Free Online!

Classic Investment Book, Elliott Wave Principle , Now Available Free: Robert Prechter has just released a complimentary online edition of Elliott Wave Principle: Key to Market Behavior . All 248-pages of this classic investment book can be on your screen in just minutes. Elliott Wave Principle will teach you the 13 waves that can occur in the charts of the financial markets, the basics of counting waves, and the simple rules and guidelines that will help you to apply Elliott Wave for yourself. You'll learn the method successful investors have used for decades. Access Your Free Copy of Elliott Wave Principle, Now.

WD Gann's Ultimate Secrets Unveiled!

"Seek and ye shall find, knock and it shall be opened unto you." “ Time is the great factor and proves all things.” “ There is a time and a season for everything, and if a man does things according to the time, he will succeed.” “ If man know there is a time to stop trying to make money and to keep what you have, then wait for another season when the time is ripe, they could continue to succeed indefinitely." “ Find the correct starting point, and know the cycle which is going to be repeated. Begin right, the right beginning will get the right ending.” "Happy is the man that findeth wisdom, and the man that getteth understanding.” Yes, I'm extremely happy as I have found the ultimate WD Gann Secrets to Stock Market Forecasting. “The future of Straits Times Index (STI) has become an Open Book" to me as I know when the next major top or bottom would occur with 99% certainty! This is enough for me to become successful indefinitely, to b