Posts

Showing posts with the label Stock Market Tips

Trust Bank Singapore, New Digital Bank Freebies!

Image
Have you applied for your Savings Account or Credit Card with Trust Bank Singapore, Singapore's digital bank backed by a unique partnership between Standard Chartered Bank, and FairPrice Group? REFERRAL CODE: BZACYE0F ( it is a number zero, not letter ) Get $35 worth of free Fairprice vouchers and other freebies by just Downloading the Trust App and Open a Savings Account online with the App, simple/easy within 10mins!: Get free $10 Fairprice E-voucher (no minimum spend at stores/online) by entering this code ( BZACYE0F ) when apply for the Savings Account. Get free 1kg Fairprice Rice voucher Get free Kopitiam Breakfast Toast Set voucher Charge one transaction to your debit card to get free Fairprice $25 voucher (no minimum spend, at stores/online). Hack: Do a funds transfer of $1 or $10 from your own bank to Trustbank savings account. Then Just add your debit card number to Grab App, authenticate with $1 charge/refunded to your saving...

Making Money Trading CFDs

Last month I was at InvestFair, attended a few talks and decided to open a CFD account to prepare for the coming Bear Market (oops, when?). I created a demo account with the same broker to familiarise with the platform and to test the trading method I learnt from a US Trader online. Guess what I discovered? The method I used helped me identified the potential rebound after the big selling! Wow! I continued to use the same method to test trade CFD indices (SIMSCI, Hang Seng, DOW and S&P500) and Gold. Wow! Amazing! I decided to use the same method to test if Stocks rebound can be identified the same way. Wow, wow, wow! Amazing! Trading using CFD is much cheaper. No commission for Index CFD and Gold (built into the spread) and only 0.08% for SGX Stocks. There is some finance charges for holding. It is almost 24 hours! I will continue to test trade. Oops, I dun have much time as I have to take care of mum. Patience is key to this game of winni...

Secret to Stock Market Time Cycle

I just finished reading this book. Do you know: 1. The Bible was written by astrologers? 2. The Bible is an astronomical book, a text book of heaven? 3. Son of God refers to Uranus? 4. Satan refers to Saturn? 5. Holy Ghost refers to Neptune? Wow! Mystery of the Bible! Now I think I know why WD Gann reads the Bible and wrote the book "The Magic Word". Oops! "As it is in heaven, so it is on earth", Oops, who said that? No wonder Financial Astrologers can sometimes forecast the Stock Market with high accuracy! My Stock Market Time Clocks is based on the Bible. No wonder sometimes the turn dates coincides with major planetary alignments. Oops, if I get the start date correct! WD Gann said, start with the right date and you will get the end date right!

USA Headed for Second Recession?

Image
Are we headed for a Second Recession? Per article posted by Streettalklive, the following indicators show high likelihood: 1. Chicago Fed National Activity Index - a small step to crossing the 35 mark, which has always been a pre-cursor to recession. 2. Graph of Real GDP Growth - shows downward growth heading to below 2% line, which has been indicator of a recession in the past. Almost every drop below this line has led to a recession since 1947.

Cheapest Brokerage in Singapore

Image
Do you know that Lim&Tan Securities charges the lowest commission rates for S$ online trading in Singapore? Do you know which Singapore Broker is the "s----"? Beware of this Singapore Broker (in red)! It uses "different English words" (see highlighted in red) to describe it's commission schemes as compared to the other Brokers! Below is the table comparison of commission rates for local brokers only. I do not trust foreign brokers as I have heard of cases of "problem with funds".

Jeremy Grantham – US Market Outlook 2011

Jeremy Grantham's 4Q Client Letter is out! Summary of Key points to note: Be prepared for a strong market, Year 3 of Presidential Cycle typically does well. But beware. S&P500 worth 910. If S&P500 rises to 1500 by October 2011, if market and economy could survive small possibilities of double-dips, you shld probably be thinking much more conservatively. It would officially be the latest true bubble! All famous bubbles broke only after short rates had started to rise. Only a couple broke in midst of declining rates. If commodity prices rise so large in next few months, governmental policies in emerging markets might put a stop to the global equity bull market.

CLSA Fengshui Index 2011 - Year of Rabbit

Image
CLSA Asia-Pacific Markets released its 17 th Annual Report “Fengshui Index 2011 ” on Wednesday January 19, 2011. “The year of the rabbit in the Chinese lunar calendar begins next month, and for investors in Hong Kong, that means the stock market will go up in short bunny hops.” "The rabbit is a very cautious animal. Every time it hops a bit, it turns around and checks out the environment - is it safe? - before moving on." “That's how Hong Kong's benchmark Hang Seng Index will also perform in the year of the rabbit, which begins on Feb. 3.” "The market will go up but every now and then it will slow down take a breath, take a look at the surroundings, evaluating what is going on and continue to go up. It will be a zigzag market," “Feng shui is the traditional Chinese practice of predicting fortunes through dates and classical Chinese texts as well as using timing and the placement of objects to improve luck. The term feng shui literally means wind ...

A 2011 Stock Market Forecast?

Image
Here is a summary of Citigroup's 2011 Stock Market Forecast based on history (source Pragcap.com): US markets likely to peak on January 3 2011 January 2011 down about 5% Intra year bear market fall of over 20% 2011 close down by 16%+/- Wait 6 to 8 years to see DJIA 2007 highs Wow! Have you read something similar from my Stock Market Time Clocks: like watch January 4 & 7 2011, 3 Phases of Bear Market 2007-2017 , STI Head & Shoulder Top, etc? But beware Wave 3 of 3 down might be starting in STI if it breaks the neckline! And here is the historical data used by Citigroup (source: Pragcap.com)

Jeremy Grantham: Be in Cash, Wait for Stocks to Fall

Thursday November 12 2010, Jeremy Grantham told CNBC, extracts below: Investors should be mostly in cash, which gives them security as well as the option to take advantage of other investments if prices fall. “Cash has a virtue that people don’t appreciate fully, and that is its 'optionality'.” “If anything crashes and burns in value—say the US stock market—if you have no resources, it doesn’t help you. If the bond market crashes, and you have no resources, it doesn’t help you. What cash is is an available resource." Grantham thinks stocks are overpriced, so being in cash now gives investors the chance to enter the market later. “It buys you the right to buy the US market if the S&P drops from 1,220 today to 900, which is what we think is fair.” Grantham also recommended investing in such commodities as oil and copper for the long term of 10 to 20 years. For institutional investors, Grantham said a good mix is to be overweight in franchise companies, modestly...

Closest Encounter with Jupiter until 2022

I just received an email from NASA Science News, extracts of key message as follows: " Jupiter is approaching Earth for the closest encounter between the two planets in more than a decade--and it is dazzling. The night of closest approach is Sept. 20-21st . This is also called "the night of opposition" because Jupiter will be opposite the sun , rising at sunset and soaring overhead at midnight. Among all denizens of the midnight sky, only the Moon itself will be brighter." "On Sept. 20th, Jupiter will be as much as 75 million km closer than previous encounters and will not be this close again until 2022." "Coincidentally, the planet Uranus is also at opposition on Sept. 21st . On that night it will travel across the sky alongside Jupiter, although not nearly so bright." Read more here Wow! How will these affect the stock market? According to one "expert org's" stock market cycle projection, US stock market will likely star...

Sell & Go Away in May, Singapore!

Daryl Guppy said “Sell in May and Go Away in 2010, Singapore!”, in an article he wrote on May 25 2010. Daryl said “this saying is surprisingly most accurate in the Singapore market”: Singapore market traders who follow this advice miss good profits in 45% of the past 20 years. The 55% probability of a falling period does justify following the advice. However, this result is skewed by a cluster of badly performing years prior to 2002. Here there was a 77% probability that selling in May was the correct action. The worst year was a loss of 43% in 2008 where selling in May made sense. The best year was 2009 with a 41% return. For 2010, the market this year could just develop the conditions to make this saying come true.

December Low Indicator Warning!

According to Stock Trader's Almanac: “Pay more attention to the December Low Indicator. If that low is violated during the first quarter of the New Year, watch out!” When the Dow closes below its December closing low in the first quarter, it is frequently an excellent warning sign. Dow closed below its December 2009 closing low of 10285.97 (Dec 8 09), triggering the dreaded December Low Indicator. Since 1950 when the December Low Indicator has triggered, the Dow has fallen an additional 10.9% on average. This was precisely the case the past two years with the Dow losing an additional 42.1% in 2008 and 17.6% in 2009 before surpassing the previous high. Excluding 2008’s drop, the largest of them, reduces the average subsequent drop to about 10% -- that would put the Dow at about 9155. The most prudent course of action is to refrain from major new purchases, tighten stops, take any sizable short term profits and assess the conditions at week’s end.

Jeremy Grantham Stock Market Outlook 2009-2010

Jeremy Grantham just released his Q3 Client Letter (Just Desserts and Markets Being Silly Again) on his outlook on US Economy and Stock Market. Hmm... is he hinting about a repeat of 1929 – The Last Hurrah and Markets Being Silly Again – after the sharp decline in the fall of 1929, the S&P500 rallied 46% from its November low, then fell over 80%. Other key points to note: It still seems a safe bet that seven lean years await us. Fair value on S&P is now about 860. This places today's market (October 19) at almost 25% overpriced. We face a seven-year future that almost everyone agrees will be tougher than normal. We are nervous about a possibility of a major shock to Chinese growth (a one in 3 chance that a major China stumble in the next 3 years). What will stop this market in the first few months next year? A combination of 2 factors: Disappointing economic and financial data will begin to show the intractably long-term nature of some of our problems, particul...

Trading is Risky, Will Lose Money?

Is Shares/Warrants Trading Risky? One local Professional Trader cum Trainer said “You are guaranteed to lose money in Trading. So must have money management or risk management rules put into practice so that what you lose is less than what you make over time.” In short, he is preaching there is no perfect trading method/system, no holy grail, cut loss if you are wrong. So he is telling you his trading method taught to students also has weakness. Do you know why it will fail, when it will fail and what will fail? Why pay to learn from him? Haha, today, this Professional Trader wrote in his blog saying he is confused with the US markets and now sitting on the fence. Would I want to pay to learn from him? One US expert trader said “If Trading is Risky, Why Trade and lose Money? Find a Winning System! Otherwise, dun trade! I agree with the US expert. Why trade and lose money? Why trade and be prepared to cut loss when you know the trading method has weakness? If I know the ...

Will September Markets Be Bullish?

Below is summary of key points extracted from an interesting US newspaper column published on September 4, 2009, written by a market timing expert: The market has done quite a job of ignoring its history so far this year. January and February, usually positive winter months, it experienced a sizable loss of 25% . In historically favourable period, not launching into a sizable rally until March. Defying its historical “Sell in May and go away” history, the rally continued to roll right through May. It did decline for four straight weeks beginning in June, following its history of “If May doesn’t get you, June will”. The rally then resumed in July, also not unusual, as there is usually a minor summer rally. But the summer rally continued through August, the first month of the market’s historically worst three-month period of August, September, and October. That has a lot of people claiming that since the historical patterns have been off so much so far this year, they will therefore be...

Solar Eclipse July 22 2009 Impact on Stock Market

What message did I receive in the email from the Astro Expert this morning? There are 2 Groups of Planets coming face to face: Optimistic Planets which create the stock market bubbles and Pessimistic Planets which are coming to burst the bubbles (another stock market crash?) Who will win the battle? Optimistic Bulls or Pessimistic Bears? Expect explosive energy or high volatility from today till next week. Especially August 18, 2009, one new moon from the Solar Eclipse on July 22, 2009. ( I thought new moon is on August 20, 2009) Do you know what day is August 18, 2009 and August 20, 2009? “While these planetary alignments may not be the specific trigger for a huge plunge in the markets, the potential is there. So you might want to take defensive measures if you are long in stocks.” “Even if we don't get a major market pull-back during the coming week, we need to stay alert for a big trend reversal at this time. The likelihood of a significant correction is extremely high d...

Head Test of Head & Shoulder Pattern

Image
Wow, here's another expert trader's view of the US Market: "It is normally very common for the market to rebound after the break of the neckline, then proceed to test the Head or middle of the Head of the Head & Shoulder Pattern. If the market fails to break above the Head, the next decline is normally quite drastic. Of course, if it succeeds, then it will fly." And here's another blogger's view, I'm impressed at the research he had done. Comparing 2009 to 2003's Head and Shoulder Pattern. See for yourself where S&P or Dow will likely to head to next, based on 2003's history! Wowie! Next week there is a special Solar Eclipse! Read its potential impact on China and India....coming soon!

S&P 500 Breaks Above Downtrend?

Image
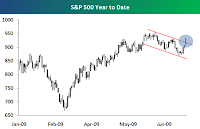
"The head and shoulders technical breakdown for the S&P 500 sure hasn't panned out this week. After breaking below the "neckline" for a day or two, the index has now shot up for 3 straight days and today it broke above the short-term downtrend channel that had formed since early June. Does this mean the index is headed back to its rally highs, or will this be another pump fake like the recent head and shoulders pattern? " (Source: B.I.G.) "Often at times when everyone has the same view of the markets and have positioned themselves in a similar manner, the market will end up doing the very opposite of what market participants expect, with this week's action in the stock market a perfect example. The S&P 500 initially broke its neckline late last week and quickly recovered this week back up to its right shoulder, and it appears as though we are currently stuck in a trading range between 870 and 956 on the S&P 500. The question now is which w...

July Stock Market Patterns

According to Stock Traders Almanac: First half generally stronger. Market often gets creamed in second half when a bear market is in progress. Time will tell whether we are still in a bear market again. Market volatility often takes hold after July 4th. Expiration week has been a mixed bag. 7.7% Dow loss in 2002, 3.6% gain last year. Week after expiration astrocious. Dow down 7 of 11 years. So, investors are better off on the sidelines this month. According to one expert market timer: Week before July’s options expirations week tends to be negative by the time it ends. Expiration week tends to be negative, down 6 of the last 9 years. Dow lost a big 4.4% on the July options expirations day alone. Week after July expirations also tends to be negative, having been down 7 of the last 11 years. (Added July 10, 2009) For other historical patterns, visit CNBC News . There is a new section on Today in US Market History - historical stock market performance for the day. Click on the current da...

5 Fatal Flaws of Trading

EWI Senior Analyst Jeffrey Kennedy discusses why most traders lose, the five flaws associated with losing, and how to overcome these five flaws to become successful. Read More .

Watch Korea Kospi - Region's Leading Indicator!

Image
Daryl Guppy wrote an analysis on Kospi yesterday. Key points to not: The KOSPI is the leading index in the region. It leads the way for other regional developments. The KOSPI has been in a sideways pattern for several weeks. This loss of momentum has been reflected in other regional indexes. The key feature is the decline in momentum as the index reaches the breakout target near 1400 and 1450. The behaviour of consolidation will provide leading indications of the behaviour of other regional markets. A break below the consolidation has a target near 1250. An upside move above the consolidation area has a target near 1650 to 1700. At this stage of development there is no indication of how the KOSPI will move. A successful consolidation and continuation will set upside targets near 1700. A failure of support at 1450 sets downside targets near 1250. A retreat to this level remains bullish. A substantial pullback and rebound is required before this can be defined as a sustainable trend brea...