Posts

Showing posts from May, 2009

Trust Bank Singapore, New Digital Bank Freebies!

Image
Have you applied for your Savings Account or Credit Card with Trust Bank Singapore, Singapore's digital bank backed by a unique partnership between Standard Chartered Bank, and FairPrice Group? REFERRAL CODE: BZACYE0F ( it is a number zero, not letter ) Get $35 worth of free Fairprice vouchers and other freebies by just Downloading the Trust App and Open a Savings Account online with the App, simple/easy within 10mins!: Get free $10 Fairprice E-voucher (no minimum spend at stores/online) by entering this code ( BZACYE0F ) when apply for the Savings Account. Get free 1kg Fairprice Rice voucher Get free Kopitiam Breakfast Toast Set voucher Charge one transaction to your debit card to get free Fairprice $25 voucher (no minimum spend, at stores/online). Hack: Do a funds transfer of $1 or $10 from your own bank to Trustbank savings account. Then Just add your debit card number to Grab App, authenticate with $1 charge/refunded to your saving

Formula Forecast Stock Market Turns – Part 2

How accurate is Stock Market Cycle Model – Formula 2? Using some mathematical formula on S&P 500 Index, it had forecasted the following (examples only): 2002 market bottom (+/- few days) 2007 market top (+/- few days) March 6, 2009 bottom or trough May 8, 2009 peak I researched, tested and “created” a modified version of the formula, so it gives the exact date of the 2002 bottom and 2007 top. Then, I discovered a formula to calculate the possible dates of the bear market bottom, next bull market top, interim peaks and troughs. The only issue is I can only confirm near the forecasted dates whether it will be a peak or trough, not in advance. I'm still doing research on this. In the process, I discovered there is some “correlation” between this Cycle Model Formula 2 to Cycle Model Formula 1. Aha...these might even give some clues as to why The Joseph Cycle failed to forecast the last bull market top, and the correct interpretation of 7 Bull Years and 7 Bear Years! Wonder if M

Formula Forecast Stock Market Turns - Bingo!

What have I been busy with lately? Recently, I found two stock market cycle models which accurately identified most market peaks and troughs. Stock Market Cycle Model – Formula 1 How accurate is this Stock Market Model? Using some mathematical formula on the DOW Index, it accurately forecasted the following (examples only): May 2006 peak October 11, 2007 market top March 6, 2009 bottom or trough May 8, 2009 peak (or was it not?) It seems to be reliable to forecast peaks and troughs but not so reliable to forecast day to day movements. I tested the model's calculation, not always reliable - May 27, 2009 down, May 29, 2009 up. WOW! Correct! Haha, incorrect ones, I no show you lah! Amazing! I'm still continuing with my research. There is a risk it might not continue to work when made known or after some time. Hmmm... murphy's law! So, should I "fire" all the other experts, giving me not reliable forecasts so far? What can the Stock Market Cycle Model - Formula 2 do?

Gold Investment a Safe Haven? - Free EWI E-Book

Do not invest in gold or silver until you read this free 40-page eBook. Not all gold and silver investments are created equal. You'll learn which are the best and exactly when they're the best with this brand-new eBook that will change the way you think about precious metals. Learn more about the free 40-page Gold and Silver eBook here. Beware: Gold is setting itself up for "the buy of a lifetime." Only the resource we're about to share with you will help you prepare for it. Do you invest in precious metals? Should you? Only you can answer the first question; we've written this letter to help you with the second. Gold bugs have long touted the yellow metal's time-tested store of value. But, contrary to popular opinion, gold isn't always the best investment when times get tough – and we have the analysis to prove it. Our friends at Elliott Wave International have just released a brand-new eBook that will help you decide just how – and when – gold and si

May 25 Weekly Update - Stock Market Forecast

May 25 Weekly Update - Stock Market Forecast Fengshui: Likely profit taking May 25/26, slowdown rest of week. Financial Astrology : Neptune retrograde May 28, Mercury turns direct May 30. Jupiter/Neptune conjunction starting May 27 might result in market selloff instead of rallying. Technical Analysis : US indices – markets likely to drop Tuesday. This might be a sharp and long wave down.

Watch Nasdaq Composite for Leads!

Image
Watching Nasdaq behavior provides leading clues to the best trading reactions in the markets which follow this lead. The Nasdaq index has provided consistent leadership in market development since the beginning of the bear market in late 2007. This information is especially useful if you are trading the Dow or the S&P 500, as these indexes follow the Nasdaq with a lag of several days.. This is how we will apply the trading strategy to catch the NASDAQ by the tail in the next few weeks: Determine if this strong uptrend is a rally or a genuine trend. If it's a rally, then we trade with tight stops designed to protect profits in open positions. If it's a long term uptrend then the stops are further away and traders can use the dips to add to existing positions. A rebound from short term uptrend line support near 1,700 continues the rally. This has not developed. Trend lines do not have to start at the very pivot point low of the downtrend. The trend line is used to define the

Who are the Leaders in Asia Stock Markets?

Image
According to Daryl Guppy, China's Shanghai Composite is the leading indicator of recovery . Korea's Kospi is the leading indicator for Asia. Korea's Kospi, like Straits Times Index and Hang Seng Index, is a follower of the US Market. Korea's Kospi has also broken strongly above the trading band and is reaching towards the trading band targets. (see note below) A tip from Daryl Guppy ( I received during the talk I attended in late April 2009), if Kospi "dies", ie cannot break 1450, the rest of will follow. Game over! (Note: this Chart is not latest. Todate, Kospi had broken 1400, hit 1430+ and retreated. So, Watch out!) Taiwan, Hong Kong and India have also broken above the upper edge of the trading band. Australia has not. Australia lags trading band development and breakout behavior when compared to other regional markets. Not surprisingly, when the width of the trading band is measured and projected upwards it gives a target near 4400 which also is near the

China's Shanghai Composite – The Leader!

Image
The US market stumbles and regional markets follow, but the Shanghai market hardly sneezes except for a minor retreat last Thursday. This acts as a counterbalance to the impact of US weakness on markets such as Taiwan, South Korea and the red-chip sector in Hong Kong. A combination of weakness in the US and trend weakness in China would pose a more serious threat to regional recovery. Shanghai's index-trend strength remains well established but includes some cautionary factors: Index approaching very strong and significant consolidation area between 2600 and 3000. It will require very strong trend strength to move into this area, likely over several weeks. It is still affeted by world market behaviou, particularly US. US market rally is showing reduced momentum and has high potential for substantial market retreat and will have some effect on Shanghai Index – it might retreat to retest support below 2600. The retreat will not change the direction of the long term uptrend. Probabili

Another Bottom for Stocks Coming: Jim Rogers

The stock market may hit new lows this year or the next as the current rally has been largely caused by the money printed by central banks and fundamental problems remain unsolved, legendary investor Jim Rogers told CNBC Wednesday, May 20, 2009. His views echo those of renowned bear Marc Faber, who told CNBC last week that the rises in share prices did not mean the world was embarking on a path of sustainable economic growth. "I'm not buying shares if that's what you mean. Not at all. The bottom will probably come later this year, next year, who knows when." "Governments have not solved the essential problems that caused the crisis but instead they "flooded the world with money." Trying to solve the problem of too much consumption and too much debt with more consumption "defies belief" and will not work.” A long-term advocate of commodities, he reiterated that this will be the first sector to rise when the world gets out of the crisis, as inv

May 18 Weekly Update - Stock Market Forecast

May 18 Weekly Update - Stock Market Forecast Fengshui: Likely volatile week, with some strength on 21 & 22 May 2009. Financial Astrology: With multiple planetary movements, markets likely looking for direction. Which planet has stronger influence? Technical Analysis: US indices – market likely to rebound. There is a turn date on May 20, 2009. Would it be a top or bottom? FOMC minutes will be released on May 20, 2009. Did you read “ Asian Stocks due for Correction” ? I just received a “Crash Alert June 2009” from one astro expert – not sure how reliable. Another astro expert say watch first half of June 2009 for clear market direction. Be careful hor. Recall Fengshui Forecast for 2009 !

New EWI Independent Investor Ebook - Free!

The old adage says, "you are what you eat," and today we're offering you a heaping portion of brain food. At long last, the mainstream media is beginning to question buy-and-hold investing – it's a myth that EWI's original Independent Investor eBook debunked years ago. Even the "Efficient Market Hypothesis" has come under fire from the Oracle of Omaha himself – the Independent Investor long ago exposed EMH for the fantasy it is. Now that the mainstream has finally caught up to these myths, the Independent Investor eBook can once again put you ahead of the herd; you can understand truths today that the mainstream will catch up to someday in the future. You'll get the most groundbreaking and eye-opening reports ever published in Elliott Wave International's 30-year history, PLUS 6 brand-new chapters (43 new pages) of specific analysis, forecasts and commentary that will help you think independently in today's tumultuous market. Tens of thousan

Bear Market Rally or Trend Change?

How to differentiate a Bear Market Rally from a Potential Trend Change? Rally traders reaped considerable profits. Investors lost even more money. Understanding the differences in rallies is important if we want to keep our money, or make it grow in the market. There are three types of rally situation: A rally in a downtrend A rally in a trading or consolidation band A rally that is a precursor to a significant change in the trend. The first step, which is surprisingly ignored by many traders and investors, is to determine if we are in a bear market. After the battering of 2008, it is comforting to believe we are entering a market recovery so we naturally look for all the evidence that supports this view and conveniently ignore evidence that points in the other direction. This is a dangerous approach to take in any market condition. Many new up trends start with a rally, but not all rallies go on to develop into a new up trend. A rally is a rapid and substantial change in the direction

Singapore Stock Market a Bear Market Rally!

Image
Key points from article written by Daryl Guppy this week: It is not a pretty picture. The trend line starting from the November 2007 high and touching the May 2008 high defines how high the market has to rise before we can say the downtrend has ended. The value is around 2300. That’s a big jump, and a strong rally from the trading band breakout at 1900. The long term Guppy Multiple Moving Average (GMMA ) indicator also confirms the analysis. The long term GMMA provides a resistance barrier. The lower edge of this barrier is near 1900. The upper edge of the long term GMMA is near 2250. This is a wide barrier. As the market moves through this area, it must be able to retain trend strength. The wider the GMMA bands, the more difficult it is to maintain the momentum of penetration. This, and the position of the trend line suggest there is a low probability of rapid trend change. It suggests there remains bearish pressure. Of course the rally from 1900 to 2300 is eminently tradable as rally

“Kiss of Death” Chart Pattern?

Image
One TA expert noticed all US Market Indices have the same “Kiss of Death” Chart Pattern after last night's technical rebound. Last night, all US Market Indices rebounded to test the neckline of the saucer top or rounding top in the 15 minute chart and dropped. There is resistance from the upper trendline. This is a very bearish pattern. If the indices cannot hold or breakout above, it will likely plunge! I also noticed Straits Times Index 15 minute chart has the same pattern. So I'm watching for it to test the neckline at around 2173 to see if it drops by end of day. I'm also watching Hang Seng Index and Nikkei to see if these test 16700 and 9290 thereabouts and drop. These are potential signs of more downward correction to come. Beware!

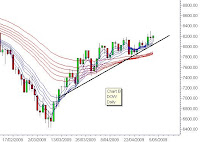
Dow Chart Shows A Bear Market Rally!

Image
Daryl wrote a comparison of Dow rally chart vs Hang Seng Index rally trend chart yesterday. Key points to note on the Dow Chart: The Dow has all the features of a extended rally, but none of the features of a trend. A rally has a single trend line that has not experienced any significant rally and retreat behavior. It is difficult to place an accurate trend line on the Dow chart. The trend line that most correctly defines the behavior is shown. There is no rally, retreat and rebound activity in this period. It is simply a series of minor tests of the support function of the trend line. This behavior underlines the rally characteristics of the Dow. Where is the rebound point for the Dow when the current rally collapses? Is there weak support near 7,500 based on the spike lows in November? Or is there a support near 6,500 from the March 2009 lows? The separation in the long-term GMMA is narrow. This shows there isn't strong support from investors. There is a low probability investors

Options Expiration Week Performance

Image
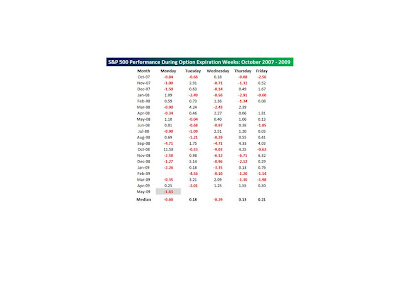
With the S&P 500 down over 1.6% at the moment, today is shaping up to be just another Monday of an options expiration week. Since the S&P 500 peaked in October 2007, Mondays of options expiration week have been notoriously bad with a median decline of 0.6% and positive returns only seven out of eighteen times. Above: Source B.I.G. Note the performance for Tuesdays when Mondays are down more than 1%. Note the performance for Wednesdays, Thursdays and Fridays thereafter. Do you see a pattern?

Free EWI FOREX Forecasts !

Our friends at Elliott Wave International have just announced the beginning of their wildly popular FreeWeek event, where they've thrown open the doors to some of their most popular paid services to non-subscribers for one week only. You can access EWI’s intraday and end-of-day Forex forecasts right now through next Wednesday, May 20. This unique opportunity only lasts a short time, so don't delay! Learn more about EWI's FreeWeek here. About the Publisher, Elliott Wave International Founded in 1979 by Robert R. Prechter Jr., Elliott Wave International (EWI) is the world's largest market forecasting firm. Its staff of full-time analysts provides 24-hour-a-day market analysis to institutional and private investors around the world.

Mercury Retrograde End Market Rallies?

One Astro Expert noted: Most Mercury retrograde periods come near the end of rallies in the last 2 years Might suggest weakness during the retrograde period of May 7-30, 2009 and/or soon after in June. Another Astro Expert noted: Sudden reversal happen in middle of Mercury Retrograde period. Mercury entering Sagittarius (May 19-30) tends to correspond to sharply rising prices in precious metals and currencies, and declines in stock prices. Whatever you think is suppose to happen, usually doesn’t. Many things go exactly the opposite of what you anticipate. Many bullish and bearish technical signals tend to be negated A lot of “fake outs” as prices run above resistance and below support, only to reverse again. One TA expert noted: In March 2008, the markets rallied for 9 weeks and reversed in the 10th week. March 2009, markets rallied for 9 weeks, this is the 10th week! Hmm... I also notice that Fengshui Forecast is less reliable when there is any planet retrograde. Will the Bear Market

May 11 Weekly Update - Stock Market Forecast

May 11 Weekly Update - Stock Market Forecast Fengshui: Some signs of strength first part of week. Financial Astrology : Watch the period May 15-20 – middle of Mercury retrograde period when sudden reversals might occur. Technical Analysis : US indices – might decline Monday, rest of week to be reviewed. Did you notice Bloomberg news "Insiders selling jump to highest level since 2007"? Signs of distribution? Hmmm... some major shareholders are also selling as STI rises! Did you read “Asian Stocks due for Correction ”?

Asian Stocks due for Correction - EWI APFF May 2009

Extracts from May 4, 2009 Bloomberg News: Asian stocks are on the “final leg” of a rally from their March lows and face a “correction” by the middle of the month , Elliott Wave International Inc. said in its May Asian-Pacific Financial Forecast Report released on May 1, 2009. “Corrections are due in most Asian-Pacific indexes by mid- May, and they should last through the end of the month and possibly into June. “Thereafter, the multi-month rally should resume.” Benchmark indexes in South Korea, China and India are among others that may decline as volumes and the rate of change slows, according to the report.

Jeremy Grantham talked about Joseph Cycle?

Still remember the legendary investor, Jeremy Grantham ? Yes, he had just released his May 2009 Quarterly Letter to his clients. In this issue, he mentioned Joseph, Seven Lean Years - “... with masses of help from incompetent leadership, we probably do face a period that will look and feel painfully like 7 lean years and they will indeed be following about 7 overstimulated very fat ones” Note other Key Extracts from the Letter: We are likely to have a remarkable stock rally, far in excess of anything justified by either long-term or short-term economic fundamentals. S&P 500 quite likely to run way beyond fair value (880) to 1000-1100 or so before end of year. Market always anticipates an economic recovery (normaly leads by 6 months, plus/minus 2) and sometimes, it must be admtted, there are several false moves (“suckers' rallies”) before the recovery takes place. Unless you have extreme luck or divine guidance, you will never catch the low. Everyone and his dog will be claiming

Where Hang Seng Index Rally Heading?

Image
Where Hang Seng Index Heading? Hang Seng Index follows Dow and ??? ( Akan Datang). Says Daryl Guppy, who wrote an analysis on the index yesterday. Key points to note: Hang Seng is trading within a broadly defined trading band. The lower edge of the band is near 11,000. The upper edge of the band is near 15,500 which acts as strong resistance/support level. The key to a continuation breakout is the ability of the market to test and retest 15500 as a support level. The width of the trading band is used to calculate potential downside and upside targets. The strong breakout above 15500 has an initial upside target near 20,000 which is near the 20400 historical support and resistance. There is a low probability the market will quickly move to these levels. There is an historical support/resistance level near 18500. Traders will watch for a retest of the upper edge of the trading band acting as a support level near 15500. The downside target for this trading band pattern is near 6500. This

May 2009 Stock Market Forecast

May 5 to June 4, 2009 This is the Yin Earth Snake month. Strong earth energy first half might calm the market, with possible strength or profits for metal industries in second half. Opportunities for one to invest especially in metal related industries. Favourable industries/sectors: Metal and Earth Technical Analysis : US indices – likely start of next corrective wave down before rally resumes. Financial Astrology : Mercury retrogrades on May 6/7, 2009 through May 30, 2009. Its the cycle when things can go wrong. Murphy's Law! Retrograde periods often mark market turns. Sudden reversals might occur in the middle of the retrograde. There are other major planetary movements which might mark market turns. Lookout for more details in the weekly update forecasts! Forecast for Week of May 4, 2009 Markets likely to be slow and weak with potential volatility on May 6, 2009. Another heavy week of potential market moving economic reports. Key ones on May 7 (Bank Stress Test Results), May 8