Posts

Showing posts from 2009

Trust Bank Singapore, New Digital Bank Freebies!

Image
Have you applied for your Savings Account or Credit Card with Trust Bank Singapore, Singapore's digital bank backed by a unique partnership between Standard Chartered Bank, and FairPrice Group? REFERRAL CODE: BZACYE0F ( it is a number zero, not letter ) Get $35 worth of free Fairprice vouchers and other freebies by just Downloading the Trust App and Open a Savings Account online with the App, simple/easy within 10mins!: Get free $10 Fairprice E-voucher (no minimum spend at stores/online) by entering this code ( BZACYE0F ) when apply for the Savings Account. Get free 1kg Fairprice Rice voucher Get free Kopitiam Breakfast Toast Set voucher Charge one transaction to your debit card to get free Fairprice $25 voucher (no minimum spend, at stores/online). Hack: Do a funds transfer of $1 or $10 from your own bank to Trustbank savings account. Then Just add your debit card number to Grab App, authenticate with $1 charge/refunded to your saving
December 28 Weekly Update - Stock Market Forecast

December 28 Weekly Update - Stock Market Forecast Fengshui : Market likely to weak. Dec 28 likely to be volatile. Financial Astrology : There are bullish and bearish planetary alignments. Can bullish planets continue to support the markets? Watch these dates: Dec 26 – Mercury retrograde might signal short term reversal Dec 31 – Full moon partial lunar eclipse Technical Analysis: (TA Masters on vacation) What my Stock Market Time Clocks say? Watch December 28 2009 and January 4 2010.

Market Myths Exposed - Free Ebook

Free 33-page Investment eBook: Our friends over at Elliott Wave International have just released a brand-new ebook to help you sell and fold bad investment advice forever. EWI's 33-page Market Myths Exposed eBook takes the 10 most dangerous investment myths head on and exposes the truth about each in a way every investor can understand. Please learn more about the 33-page Market Myths Exposed eBook , and download your copy now. You've no doubt heard the old mantras "stocks for the long haul," "diversify," "buy and hold." Investment gurus worldwide repeat them daily ad naseum. But are they really wise investment strategies for ALL markets as advertised? Can any piece of advice that's so simple yet so vague be of use to you as an investor? Anyone who diversified their portfolios across several stocks, bonds and commodities over the past three years knows that diversification is no foolproof way to profit. The same goes for anyone who

December 21 Weekly Update - Stock Market Forecast

December 21 Weekly Update - Stock Market Forecast Fengshui : Market unlikely to see strength this week. Financial Astrology: There are bullish and bearish planetary alignments. Can bullish planets continue to support the markets? Watch these dates: Dec 20 – Mars retrograde, usually signal trend reversal in stocks and commodities. Watch prices for next 10 days. Dec 21 – Jupiter conjunct Neptune and Moon is bullish? Dec 26 – Mercury retrograde Technical Analysis: US indices – Markets continue to trade in side-way price channel. Which way will the market go? A break below channel support will likely signal start of Wave C down.

W.D. Gann - Master of Stock Market Time Cycles

I dream, to be the next "W.D. Gann – Master of Stock Market Time Cycles, for investing"! Oops, will my dream come true? Recently, I've been very busy doing alot of research, reading the “works” of W.D. Gann, etc and testing my Stock Market Time Clocks. One “W.D. Gann” expert said maybe W.D. Gann knew the mathematical formula. But to continue to sell his forecasting services and training courses, maybe he kept it a secret. Hmm... I guess so, but he did mention one must read his “works” 3 times, then maybe will get his message (the mathematical formula). I'm still reading his "works". I have tested his Stock Market Forecasting Cycles and discovered it helped identify whether the turn date will be a top or bottom, whether it will be bear or bull cycle. Hmm...my Stock Market Time Clocks already incorporate W.D. Gann's “secret”! Oops...I'm still working very hard with my research, still so much more to read, analyse, tests, forecast for 2010,

December 14 Weekly Update - Stock Market Forecast

December 14 Weekly Update - Stock Market Forecast Fengshui : Market likely to see strength, except for December 14, while Dec 15 likely to be volatile. Financial Astrology : There are bullish and bearish planetary alignments in the sky. Who will win the battle: Bulls or Bears? Technical Analysis: US indices – there is a bullish and a bearish pattern forming in the indices. Which way will the market go? If S&P 500 breaks 1083 channel support, it would likely be a sell signal.

Learn What's Really Behind Stock Market Moves

Our friends at Elliott Wave International are offering a free 50-page report from Robert Prechter. Although originally published in 1985, “Popular Culture and the Stock Market” is so timeless and relevant that USA Today covered its insights in a recent November 2009 article. The report walks you through the ups and downs of the DJIA -- our most sensitive meter of social mood -- and analyzes the trends in popular music and TV shows through periods of positive and negative social mood over the past century. It reveals how social mood as reflected in the stock market actually defines popular culture. Download "Popular Culture and the Stock Market" Today! About the Publisher, Elliott Wave International Founded in 1979 by Robert R. Prechter Jr., Elliott Wave International (EWI) is the world's largest market forecasting firm. Its staff of full-time analysts provides 24-hour-a-day market analysis to institutional and private around the world.

How to Spot Trade Setups - Free Ebook

Our friends at Elliott Wave International, the world’s largest market forecasting firm, have just updated their free report, How to Use Bar Patterns to Spot Trade Setups . With thousands of downloads, “Bar Patterns” has always been a huge hit with traders. But now it’s been packed with even more ways you can use common bar patterns to spot high-probability trading opportunities: 30 charts across 15 pages! Don’t miss out on this opportunity to learn simple new ways to spot valuable trade setups in the charts you view every day. Download Your Free Bar Patterns Report Now. About the Publisher, Elliott Wave International Founded in 1979 by Robert R. Prechter Jr., Elliott Wave International (EWI) is the world's largest market forecasting firm. Its staff of full-time analysts provides 24-hour-a-day market analysis to institutional and private around the world.

December 7 Weekly Update - Stock Market Forecast

December 7 Weekly Update - Stock Market Forecast Fengshui: Market likely to be weak this week, except for December 7 & 8, while Dec 11 likely to be volatile. Financial Astrology: There are bullish and bearish planetary alignments in the sky. Who will win the battle: Bulls or Bears? Technical Analysis: US indices – there is a bullish chart pattern and a bearish chart pattern forming in the indices. Which way will the market go? If S&P 500 breaks 1083 channel support, it would likely be a sell signal. Review Friday December 4: “The US markets roared higher this morning on the back of a better than expected Jobs Report. However, it is only a minor part of why the market goes up or down. The real key is the dollar. The markets move directly inverse to the dollar and with a massive squeeze in the dollar higher, the markets have tanked. This explains exactly why the markets have rolled over in a major way – Dow reversing down more than 200 points before closing positive. This

December 2009 Stock Market Forecast

December 7 2009 to January 4, 2010 This is the Yang Fire Rat Month. Strength to the Earth element will weaken equity markets. Eq uity markets may be seen trying to gain strength during the first half. Favourable industries/sectors: Fire and Earth Financial Astrology: There are both Bullish and Bearish Planetary Alignments this month. Who will win the battle: Bulls or Bears? Watch these dates: December 16 – New Moon December 20 – Mars Retrograde December 21 – Jupiter/Neptune Conjunction, Winter Solstice December 26 – Mercury Retrograde December 31 – Partial Lunar Eclipse Technical Analysis: US Market: There is a bullish chart pattern and a bearish chart pattern in the indices. Which way will the market go? Will Phase 3 down start in December 2009 or will it be delayed till early January 2010? Protect against downside risk – if S&P 500 breaks channel support at 1083-1078, it will be a sell signal. Have you read " US Stock Market Outlook 2010 &q

US Stock Market Outlook 2010

Studies by experts indicates that the 10-Year Cycle has been the most influential cycle in US stock market trends over the past century. Statistical pattern of US Stock Market Trends: US stock market bottoms in a year ended in ‘2’; Rises to a peak in a year ended in a ‘6’ or ‘7’ ; Experiences a crisis and slump; Market rises to another peak in a '9' or '0' ended year; Followed by another market collapse, with nearly always 2 down waves early in a new decade: DOW plunges to reach a low in the '0' ended year, experiences a major rally then plunges into another low either in '2'/'3' ended years or '3'/'4' ended years. During the 2000's, the US stock market followed the 10-Year Cycle pattern: Dow peaked in January 2000 Hit a bear market low in October 10, 2002 Rose to another record peak on October 11, 2007 Serious financial crisis occurred in late 2007, stock market collapsed in 2008 with a major low reached in March 9, 2009 ;

November 30 Weekly Update - Stock Market Forecast

November 30 Weekly Update - Stock Market Forecast Fengshui: Market likely to be weak this week, except for December 3 & 4 which shows potential strength. Dec 2 likely to be volatile. Financial Astrology: Uranus turns direct on December 1 and US markets might have reversed prior to this date due to the Dubai Shock. December 2 is Full Moon. Will markets reverse up or breakout to the downside? Technical Analysis: US indices – Final Wave 5 up had truncated and Phase 3 down might have started, if there is downside follow-thru this week when trading volume picks up. A very heavy schedule of important potential market-moving economic reports this week: Dec 2: ADP employment report, Fed Beige Book Dec 4: Non-farm payrolls and Monthly Unexployment Rate Have you read " Will Dow Repeat 1987's Post-Thanksgiving Decline?"

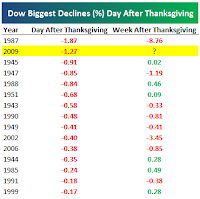
Will Dow Repeat 1987's Post-Thanksgiving Decline?

Image
The biggest decline on the day after Thanksgiving came in 1987 when the index fell 1.87%. At that point, markets were still digesting the October '87 crash, and the Dow went on to fall 8.76% in the week after Thanksgiving. Today, Dow had its second biggest decline the day after Thanksgiving (November 27 2009) since it became an official federal holiday in 1941. Source: B.I.G. Dow fell 1.27% on a half-day trading session on November 27 2009. Is the market still digesting the Dubai Shock, while most key market players were still on holiday? When all key market players are back on Monday, November 30 2009, what will happen? A repeat of 1987 "stock market crash" after Thanksgiving? Remember what happened in 2008: "first it was Bear Sterns, then Countrywide Financial a few months later. And then all of sudden, it was Citibank, Merrill Lynch, AIG and others as the banking system started to heamorrhage." So is this Dubai Shock the start of the next econo

Dubai Shock Triggers Wave C Down?

US Stock Markets are waiting to start Wave C or Bear Market Phase 3 down. Or has Phase 3 down already started in slow motion? Global Markets are waiting for US Stock Markets to give the signal. Japan Nikkei Index already plunged! Now looks like China Shanghai Index started to plunge, bringing Hong Kong HangSeng Index with it . Today European markets are dropping. My Stock Market Time Clocks already gave the signal. Elliott Wave Experts also gave the signal. So, will the Dubai Shock trigger Wave C down in US Stock Markets? Let's watch US Stock Markets when it opens on Friday. Let's watch what happens to Regional Stock Markets tomorrow. Singapore Stock Market is closed tomorrow. Take care if you have investments with exposure in Dubai! Will have more for you after I hear from the US Experts over the weekend.

Prechter: Prepare For Large Decline In Stocks 2010?

I just watched CNBC.COM Live Video today (November 24 2009) an hour ago - managed to catch interview with Bob Prechter of EWI . Watch it below: My Stock Market Time Clocks already showed me the date of the likely bottom! Hope it is correct! Time will tell! I'll be waiting there!

Has Bear Market Phase 3 Started?

I just read one blogger sharing what he read in the latest EWI Report isssued last night – EWI went short last night? Is what he blogs reliable? What do my Stock Market Time Clocks say? It is a set of complicated Stock Market Time Clocks. There are more than 3 'methods' of calculating turn dates. So what are the 3 most critical turn dates: November 17 2009 November 23 2009 December 2 2009 Yesterday, November 23 US Markets (DOW) made an all time high for 2009! Is it the end of this rally? Is it the start of Phase 3 down? Watch the Regional Markets for potential reversal today! Watch the US Markets for potential reversal tonight! Watch the 3 rd turn date!

Identifying Turning Points With Fibonacci – Free Ebook!

Elliott Wave International has just released a free 42-Page eBook, How You Can Identify Turning Points Using Fibonacci. Created from the $129 two-volume set of the same name, it’s available free until November 30, 2009. Learn more . You may be missing trading opportunities staring you in the face. The charts you look at every day could reveal high-confidence trade setups and market turning points. You can learn how, today. Elliott Wave International (EWI), the world’s largest market forecasting firm, has just released a free eBook, How You Can Identify Turning Points Using Fibonacci. It features 42 chart-filled pages of actionable Fibonacci techniques that you can add to your trading arsenal right away. You’ll never look at charts the same way again! Created from the $129 two-volume set of the same name, this valuable eBook is offered free until November 30, 2009. Don’t miss out on this rare opportunity to change the way you trade forever. Go here to download your free eBook .

November 23 Weekly Update - Stock Market Forecast

November 23 Weekly Update - Stock Market Forecast Fengshui : Market unlikely to do well Nov 23 & 24, likely to pickup Nov 25 onwards. Financial Astrology : Dow might reverse if it can find support at 10,000. Technical Analysis : US indices – Phase 3 down might have started on November 17 if markets continue to drop this week. If markets reverse up, a possibility that final Wave 5 up is not completed. A potential Head and Shoulder pattern forming in the 5-minute charts, a break below the neckline gives a downside target of 10,000. US Markets: A very heavy schedule of important potential market-moving economic reports: Nov 24: Q3 GDP revision, consumer confidence, FOMC minutes release; Nov 25: Jobless claims Nov 26: US Holiday Nov 27: Singapore Holiday

Stock Markets Turn on Full & New Moon!

Image
Wow! Even Elliott Wave Experts now include Moon Cycle when forecasting stock market turns! Did you notice US markets (other Markets as well) top out on or around New Moon and bottom out on or around Full Moon? See the S&P 500 chart! So, have Stock Markets World Wide top out on November 16 (Western see this as New Moon) or November 17 (1st day of 10th month of Chinese Lunar Calendar)? Will Stock Markets continue to drop until the next Full Moon? Let's watch!

November 16 Weekly Update - Stock Market Forecast

November 16 Weekly Update - Stock Market Forecast Fengshui: Market likely to see strength from November 16 to 18. Financial Astrology: Will markets continue to rally or decline? What could happen on November 15 when Saturn Pluto square occur? Technical Analysis: US indices – Has Phase 3 down started or are we still in final Wave 5 up? Major turn dates November 15 to 17. It was a New Moon when markets started its decline in October 2007 top. November 16 is New Moon, will markets start Phase 3 down? Have you read Stock Market Major Turn Date: Nov 15-17 ?

Stock Markets Major Turn Date: Nov 15-17?

Image
When will this Bear Market Rally end? Or has Phase 3 Down of this Bear Market already started? My Stock Market Time Clocks say Major Turn Date is around November 15 to 17. 2 US Elliott Wave experts also identified these as major turn dates. Will it be the end of this Bear Market Rally? According to Mr Joseph Cycle, for Phase 2 or Wave B rally to stop rising, there must be a significant event strong and shocking enough to kill it. What will that event be? Swine Flu Panic Part 2? Terrorist Attack? Next Asset Bubble Burst? quote from Roubini: "...one day this bubble will burst, leading to the biggest co-ordinated asset bust ever: if factors lead the dollar to reverse and suddenly appreciate – as was seen in previous reversals, such as the yen-funded carry trade – the leveraged carry trade will have to be suddenly closed as investors cover their dollar shorts. A stampede will occur as closing long leveraged risky asset positions across all asset classes funded by dollar shor

EWI Short Term Update November 10 2009

Wow! Have you read EWI's Latest Short Term Update - November 10 2009? Did you notice the possible turn dates mentioned are same as give by my Stock Market Time Clocks? The 3 rd turn date mentioned is also in my Stock Market Time Clock! Learn more about FreeWeek, and download your free reports here. Below news from Yahoo Finance Nov 6 2009: With the Dow back above 10,000 (as of Thursday's close , at least), the message from many on Wall Street is: Hurry! The recovery train is leaving the station! Don't miss out on the next phase of the bull market! Not so fast, says Robert Prechter, president of Elliott Wave International and author of Conquer the Crash. "Everybody who's saying ‘buy stocks' today or ‘buy real estate' is, I think, setting up people to get really hurt," says Prechter, who believes the bear market rally is reaching a major top. "We had a great opportunity at [S&P] 667 - that was the big opportunity," says Prechter, wh

November 9 Weekly Update - Stock Market Forecast

November 9 Weekly Update - Stock Market Forecast Fengshui : Market unlikely to see strength, except November 10 and 12 which are likely to be volatile. Financial Astrology : Will markets continue to decline? What could happen on November 15 when Saturn Pluto square occur? Technical Analysis: US indices – Phase 3 down likely started. Wave 1 down with sub-wave 2 up completing, next is sub-wave 3 down. Or will the alternate wave count play out? Have you read Stock Market Correction of 10% to 15% coming ?

November 2009 Stock Market Forecast

November 7 to December 6, 2009 This is the Yin Wood Pig Month. Water element is extremely strong this month and does not favor equity markets. It is unlikely we see potential growth this month. Gold might see correction in second half of month. Favourable industries/sectors: Wood and Metal Financial Astrology: Markets likely to be volatile. Watch these dates: November 15 – Saturn Pluto Square, could be point of heavy selling December 1 – Uranus turn direct. Technical Analysis: US Market: Phase 3 down likely started. Possible alternate wave count: final wave 5 up in process?

Stock Market Correction 10%-15% Coming!

An interview with Daryl Guppy published in The Edge Singapore November 9 Issue. Key points to note: Based on chart patterns, Gold could fall to test USD1,000, then USD960 or USD940. Breakout is unsustainable. Strength in gold is related to weakness in USD. China market corrected 20% before moving sideways, rest of North Asia and Singapore could follow. If the same behaviour repeats, there's shorting opportunity that last 6 to 10 days. South Korea's Kospi leads Hang Seng Index and Singapore index. Resistance at 1700, support at 1580/1600. Is retest of 1580 fails to hold, market will move back to 1450. Hang Seng Index : support at 21000. A fall below gives a target of 19000. HSI follows Kospi behaviour rather than Shanghai index, it is driven by western sentiment, not Chinese sentiment. Straits Times Index (STI) : strong resistance at 2750, broad support at 2650. A fall below gives a target of 2400. If overshoot, downside target is 2200. Australia ASX 200 : next le

Bear Market Rally Over: Prechter (Part 2)

FreeWeek Update: Elliott Wave International's publications have alerted subscribers -- and FreeWeek attendees -- that volume and breadth readings have been contracting throughout the multi-month rally, which signals a critical juncture ahead. EWI Chief Market Analyst Steve Hochberg wrote in his Wednesday Short Term Update , "(On Tuesday), the VIX closed back within two standard deviations of its 20-period moving average, which for the past seven months, has resulted in a near-term rally." On Wednesday, stocks closed up; Thursday saw a huge rally. On Friday morning, the Dow regained the 10,000 level. But the Update reports that the "next leg … is fast approaching." There's still time to get complete access to EWI's latest monthly reports and the Monday, Wednesday, Friday Short Term Update . A brand-new Update is online now. Read it for free when you join FreeWeek. You can also download more than 4 of EWI's latest monthly reports and read this week&

Bear Market Rally is Over: Prechter

News from Yahoo Finance: "With the Dow Jones Industrial Average once again marching closer to 10,000, many investors, especially those who missed the rally since March, must be asking themselves: Is now the time to finally pull the trigger? Robert Prechter, founder of Elliott Wave International, implores retail investors stay away… for now. Prechter, who was bullish near the lows in March, now says the stock market "is in a topping area." Why? Several factors: Slowdown in upside momentum. Recent intraday rallies are petering out before the close. Bullish Sentiment. Investors who were bearish near the lows, are now just as bullish after a 60% run in the S&P 500. To Prechter, "that's a dangerous place to be." General overvaluation of stocks. Prechter, the author of Conquer the Crash, says this is akin to the market in 1966-74 or 1929-32, where massive bear rallies gave way to another "big leg down." He's predicting

EWI FreeWeek -Robert Prechter's Latest Forecasts

Exciting News: Our friends over at Elliott Wave International are offering Robert Prechter's latest monthly market letter, The Elliott Wave Theorist , for free along with the firm's most popular U.S. analysis and forecasting publications. You can now download, print and read dozens of chart-filled pages of current analysis for U.S. stocks, the economy, precious metals, bonds, U.S. dollar and more -- and it's all free for one week only. This opportunity ends Nov. 11. Learn more about FreeWeek, and get your free reports here . Eight months ago, the stock market began a very large rally -- the gains exceeded 60% in the S&P 500. Everyone knows this. But here's a fact that has gone virtually unreported: The vast majority of those gains (about 90%) were from March through August . By comparison, September and October were sluggish. Yet the past two months have been the very time when the financial press has been the loudest about "green shoots," "rec

November 2 Weekly Update - Stock Market Forecast

November 2 Weekly Update - Stock Market Forecast Fengshui: Market unlikely to perform well this week, except Nov 5 & 6. Financial Astrology: Will markets continue to decline? Neptune will turn direct on November 4 2009, will markets reverse? Technical Analysis: US indices – Phase 3 down likely started. US Market – a heavy schedule of potential market moving economic reports: Nov 3 & 4 – FOMC Rate Decision Nov 6 – Non farm payrolls and Unemployment rate. Have you read Stock Market Crash Coming? Have you read DF/DM Warning Indicator ?

Black Monday: Ancient History Or Imminent Future?

What does the U.S. stock market now have in common with the famous crash of 1929? This news excerpt and chart from some of Bob Prechter’s latest analysis reveals startling. Read More

Down Friday/Down Monday Warning Indicator

According to Stock Trader's Almanac, a Down Friday/Down Monday market behaviour is often a warning sign of negative market direction, frequently coincides with market tops and near major market bottoms. Since 1995, there have been 126 occurrences of Down Friday/Down Monday, with 31 falling in bear market years of 2001 and 2002 producing an average decline of 12.7%. In 2001/2002, Dow loss 13.5%/11.9% over the next 3 months, lasting 53/54 days, after the occurrence of the Down Friday/Down Monday market pattern. On average, Dow loss 5.4% over 35 days after the occurrence. Did you notice the Down Friday/Down Monday behaviour over the last weekend (October 23 & October 26), the first since August 31 2009? Hmm... possible warning of market correction over the next few weeks?

Best Fixed Deposit Rate in Town?

Image
Which Bank pays the Best Fixed Deposit Interest Rate? I googled the internet and found this. Guess what? State Bank of India again! Is it the Best? Please let me know if you know of better ones. SBI Clementi Branch Promotion: 1.Fixed Deposit Rate of 1.28%! 2.Free $10 NTUC Voucher for New Accounts Opened! Hmmm... Let's go check it out this weekend!

Jeremy Grantham Stock Market Outlook 2009-2010

Jeremy Grantham just released his Q3 Client Letter (Just Desserts and Markets Being Silly Again) on his outlook on US Economy and Stock Market. Hmm... is he hinting about a repeat of 1929 – The Last Hurrah and Markets Being Silly Again – after the sharp decline in the fall of 1929, the S&P500 rallied 46% from its November low, then fell over 80%. Other key points to note: It still seems a safe bet that seven lean years await us. Fair value on S&P is now about 860. This places today's market (October 19) at almost 25% overpriced. We face a seven-year future that almost everyone agrees will be tougher than normal. We are nervous about a possibility of a major shock to Chinese growth (a one in 3 chance that a major China stumble in the next 3 years). What will stop this market in the first few months next year? A combination of 2 factors: Disappointing economic and financial data will begin to show the intractably long-term nature of some of our problems, particul

October 26 Weekly Update - Stock Market Forecast

October 26 Weekly Update - Stock Market Forecast Fengshui : Market likely to very volatile, especially Oct 26 & 29. Rest of week shows potential strength. Financial Astrology : Will markets continue to decline or will Bullish Planets help support the markets? Technical Analysis : US indices – likely to decline Monday. When wave 4 down completes, next is final wave 5 up (comprising 3 sub-waves). When will Phase 3 start? Have you read Stock Market Crash Coming?

Stock Market Crash Coming?

Image
Has this Bear Market Rally ended or going to end? Is US Stock Markets going to crash soon? Based on Elliott Wave Count by US Expert, here are the alternative Elliott Wave Counts: 1.Bear Market Rally likely ended. 2.Bear Market Rally likely in final wave 4 down now, next is final wave 5 up. When this Bear Market Rally ends, fasten your seat belt and prepare to ride the Voyage to the bottom of the C! As there is no Hindenburg Omen, the decline is likely to be slow and painful. Based on the chart patterns forming in DOW, S&P500 and Nasdaq, the downside target for S&P500 is likely be 666, the March 2009 low. What do my Stock Market Time Clocks say? 1. Stock Market Time Cycle Formula 1 – Turn dates had been accurate so far, however, the market turn direction are reversed most of the time. Next major turn dates – see chart attached. If market turn direction is reversed again, then invert the chart for the turn date market direction. 2. Stock Market Time Cycle Formula 2 – Wow!

Gold: What's REALLY Behind the Record Rise, Bull or Bubble?

When prices in a financial market go from Sea Level to Outer Space in a relatively brief time, two scenarios are at work -- and they both start with the letters “B-U.” When a precious metal goes from being a popular long-term investment of buy-and-holders to the quick, get-away “vehicle” of day-traders, two scenarios are at work -- and they both start with letters “B-U.” And when the majority of mainstream pundits see a "new paradigm" in which prices continue to rise indefinitely, two scenarios are at work – and, you guessed it, they both start with the letters “B-U.” Enter: the recent Gold Rush of 2009, when ALL of the above conditions apply. Everyone from hedge funds to housewives now hustle to hitch their asset wagon to the rising gold star. Which begs this question: Which of the possible two scenarios are at work: B-U -ll --- Or B-U -bble? Here’s the difference: A genuine bull market is driven by a self-sustaining internal dynamic that's reflected by a host of tech

China Shanghai Index Leads, DOW Follows!

Image
Daryl Guppy wrote a very interesting article published on the CNBC website today. Key extracts from the article: “We use the Dow Index and the Australian ASX S&P 200 index (XJO) as representative of markets outside the US. The DOW and XJO charts have been time shifted to the left so the absolute market lows of March 2009, match the time of the absolute market low in the Shanghai Index in October 2008. This type of time shifted display clearly shows which market is a leader and which markets are followers.” China leads and the DOW follows: 1. The DOW is now at 10,000 but how important is this in terms of global market behaviour? 2. The DOW is following the behavioural leadership of the China market. 3. The 10,000 equivalent for the Shanghai Index is 3,000. The Shanghai market reached this level and briefly powered above it before developing a trend correction. 4. The Shanghai Index remains in trend correction mode and is using price and time corrections. The price trend

October 19 Weekly Update - Stock Market Forecast

October 19 Weekly Update - Stock Market Forecast Fengshui : Market unlikely to have strength, except Oct 19. Oct 22/23 likely to be unstable. Financial Astrology : Markets decline when Mars enter Leo on Oct 16 2009. Will markets continue to decline or will Bullish Planets help support the markets? Technical Analysis: US indices – Direction uncertain for Monday. Markets likely to have found a rally top or might continue to rise. When will Phase 3 start?

2010 Year of Tiger Fengshui Predictions

Lilian Too, Fengshui Master , was the first speaker at the Wealth Summit Asia 2009. Wow! I was very impressed with her presentation, first time I attended her talk! What's her view of 2010 Year of the Metal Tiger ? 2010 Year of the Metal Tiger will be a Bad Year! There is no water element. Normally, there is hidden elements but no water element for Year 2010! Water brings wealth, no water, no good! But, there is still plenty of money to be made. It will benefit those who have water element in their Bazi or Four Pillars! Water in Bazi = Good Luck! Do you have? Good luck is all about Timing. Having patience to do nothing. Get Timing Right! ( Wow! Even Jim Rogers said “You are not going to make money unless you have good Market Timing. Stocks will be in a Trading Range for many years! ) Have you heard of “God of Wealth seated on the Tiger”? Tiger brings “God of Wealth”. Which do you want: Income Luck or Wealth Luck? Read Fengshui Outlook 2010 Year of Tiger Read CLSA

Conquer the Crash 2nd Edition Robert Prechter's Bestseller that Forecast Meltdown

Mark Hulbert's Sept. 11, 2009, column for MarketWatch.com says, Robert Prechter "came the closest … to forecasting what was about to take place." One thing the noted financial columnist left out was that many of Prechter's forecasts still lie in the future. The long-awaited second edition of Prechter's bestseller, Conquer the Crash , is finally here! Prudent investors should read his prescient insights, what he believes is still ahead and what you can do to protect your wealth today. Learn more about the special pre-order offer for Robert Prechter's bestseller, Conquer the Crash , Second Edition. Today's financial and economic tribulations were a long time in the making. Many people ask, " Why didn't someone see it coming? " But a New York Times bestselling book did see it coming. More than 100,000 people read it in time to protect their wealth. They read this about real estate: What screams 'bubble' – giant, historic bubbl

October 12 Weekly Update - Stock Market Forecast

October 12 Weekly Update - Stock Market Forecast Fengshui: Market likely to see major movements and volatile Oct 12 to 14, rest of week likely to see strength. Financial Astrology : Jupiter turns direct October 12. Will markets reverse? Who will win the battle: Bullish or Bearish Planets in the Sky? Technical Analysis : US indices – Direction uncertain for Monday. Final Wave 5 up likely completing. Alternate wave count: 2 more sub-waves coming (down then up)? When is Phase 3 starting?

Wealth Summit Asia 2009 (Oct 10-11)

Image
For just S$10, get to attend a 2-day conference and a chance to meet Wall Street Financial Legend Jim Rogers Live! Why not? Jim Rogers will be sharing “How anyone can invest profitability in commodities” Wow! Last minute, they added Lilian Too, Fengshui Master, to talk on Fengshui for Wealth! Are you attending? See you there! What can I learn? What will I learn? More when I come back!

Where to Sell Gold Jewellery?

Wow! Gold price has been going up. How high will it go? USD1500, USD2000, USD3500? When will it drop to USD550? I'm waiting. Hahaha, now that Gold price is going up, we thought maybe it is a good idea to find out where we can sell our old Gold Jewellery before Gold crash down (this is what the expert say). My sister suggested we visit Maxi-Cash to “test the market”. Oops, she received a Gold ornament as present a few years ago, so let's go find out how much it is worth now. Maxi-Cash is a modern pawnshop, recently opened a new branch at People's Park Complex. We can sell Gold ornaments to them or pawn it. The price is different, higher if we sell. Wah! Now I know where I can sell my old fashion gold jewellery when Gold price go up more! Then when Gold price drop, I can buy new fashion gold jewellery! Hahaha! Tan Koo Koo lor! (If you know of other places which offer better value, please email me. Thank you!) (Oct 8, 6.00pm - A blog visitor shared on an

October 2009 Stock Market Forecast

October 8 to November 6, 2009 The Yang Wood Dog Month shows strong earth energy. Markets likely to be volatile, with risk of great losses due to greed and manipulations. First half shows potential for gains, Second half most volatile and will be the cause of the financial market downfall. Favourable industries/sectors: Wood and Metal Financial Astrology: There are Bullish and Bearish Planets in the Sky. Who will win the battle: Bull or Bear? Watch these dates: 1.Oct 12 – Jupiter direct 2.Oct 15 – Mid point Saturn Uranus Opposition 3.Oct 29 – Saturn enters Libra Technical Analysis: US Market: After Wave 4 down is completed, next is Final Wave 5 up. Will Wave 5 up come? Will it truncate? When it truncates, fasten your seat belts, as Phase 3 down will start. October is the number one Stock Market Jinx? October 11 2009 – 2nd anniversary of October 11 2007 Stock Market Crash, start of this Bear Market Phase 1 Cycle! Heavenly Seven! Magic Seven! On October 6 2009 or October 9,

Sudden WINDFALL $24 Million in Account ?

Image
This morning, I login to check the cash balance in my trading account to confirm money had been transferred to my bank account. Wow! Surprised to see a sudden increase of more than S$20K in my account balance! Ting! Ting! Ting! First thought was: Wow, they refunded to me all the overcharged commission for the past few years! Called my sister. Decided to take a second look and do some calculation. Open the account balance again. Wow! It is S$24 Million, not S$24K! More compensation? WINDFALL! Never seen so much money in my account in my LIFE! Huat ah! Hahaha! Capture it before its gone! (This morning, I fell down and hit my head against the wall, heard a big "crack" sound. Hope my "skull" is ok. Maybe affected my eyesight. Oops, how long more can I live. Pray for me!)

Prechter Says Stocks Are Poised for ‘Major Decline’

Reported on Bloomberg, October 5, 2009, key extracts from report: U.S. stocks may suffer a “major decline” after climbing to the highest levels in almost a year two weeks ago, according to Robert Prechter, founder of Elliott Wave International Inc. The S&P 500 Index will probably fall “substantially below” 676.53, the 12-year low reached on March 9, he said. Nouriel Roubini, the New York University professor who predicted the financial crisis, agrees with Prechter that stock and commodity markets may drop in coming months as the gradual pace of the economic recovery disappoints investors. “Markets have gone up too much, too soon, too fast,” Roubini said in an interview in Istanbul on Oct. 3. “I see the risk of a correction, especially when the markets now realize that the recovery is not rapid and V-shaped, but more like U- shaped. That might be in the fourth quarter or the first quarter of next year.” Stocks, commodities and real-estate will suffer from a rebound in the U.S