Posts

Showing posts from September, 2009

Trust Bank Singapore, New Digital Bank Freebies!

Image
Have you applied for your Savings Account or Credit Card with Trust Bank Singapore, Singapore's digital bank backed by a unique partnership between Standard Chartered Bank, and FairPrice Group? REFERRAL CODE: BZACYE0F ( it is a number zero, not letter ) Get $35 worth of free Fairprice vouchers and other freebies by just Downloading the Trust App and Open a Savings Account online with the App, simple/easy within 10mins!: Get free $10 Fairprice E-voucher (no minimum spend at stores/online) by entering this code ( BZACYE0F ) when apply for the Savings Account. Get free 1kg Fairprice Rice voucher Get free Kopitiam Breakfast Toast Set voucher Charge one transaction to your debit card to get free Fairprice $25 voucher (no minimum spend, at stores/online). Hack: Do a funds transfer of $1 or $10 from your own bank to Trustbank savings account. Then Just add your debit card number to Grab App, authenticate with $1 charge/refunded to your saving

Trend Lines Make You Rich!

Image
“Trend line analysis is a little known art. It is something that takes years to train the eyes to see easily. Trend line analysis is not something easy and that is why people do not learn it. Once trained, it opens a whole new world.” Said one expert US Trader. I started learning and applying trend line analysis on Straits Times Index and key component stocks. I was amazed at how accurate it can be used to “predict” the Trading Range for the Day, the key support and resistance values/prices. It is a leading indicator, better than any other technical indicators which are mostly based on historical data and lagging. Leading Indicator? Yes, trend lines can be used to “forecast” or “predict” the “future value” of the stock or index. Also indicates if Uptrend or Rally might have ended! I use trend lines to “forecast” the Trading Range for the Next Day. It increases the probability of success in my STI put warrants trading, giving me a sure win trading method. Look at the STI Char

September 28 Weekly Update - Stock Market Forecast

September 28 Weekly Update - Stock Market Forecast Fengshui : Market unlikely to perform well, expect volatility on Sept 28/29. Financial Astrology : Mercury turns direct September 29. Will markets reverse? Technical Analysis: US indices – Direction uncertain for Monday. When Wave 4 down is complete, next is final Wave 5 up. Will we get Wave 5 up? US : A very heavy schedule of potential market moving economic reports: ADP Jobs Report , another 2nd quarter GDP revision , the ISM Mfg Index , Pending Home Sales and The Big One: Labor Department’s Employment Report for September .

Mr Market My ATM Machine!

Have you read STI Warrant Trading Tips – Part 4 ? Hor say liao! I have finally made Mr Market My ATM Machine! I'm holding 50 lots of Put Warrants overnight, not by choice, but my technical indicators show that there is high probability STI might drop next Monday. Haha, last night Dow dropped! Now HSI, Nikkei and “STI” Futures Market is showing negative. So expect STI to drop on Monday's opening! Seems luck is on my side. I managed to withdraw enough money from Mr Market's ATM Machine to pay for Mum's 85th Birthday Celebration today! Buffet catered for my whole family network of more than 30 members! It's an early celebration, actual day is on September 30, 2009. Happy Birthday Mum!

STI Warrants Trading Tips – Part 4

Have you been trading STI Warrants? Making Money? Hmm... it is now a sure win trading game for me! I recently discovered a sure win trading method. Like Sun Tze Art of War: Know Thy Enemy, Win 100 Battles! “Pai Fa Pai Chung”! Huat Ah! What's my secret weapons? Time: Using reliable technical indicators to tell me in advance when STI will begin to decline or advance. My focus is on Put Warrants cos I know what is the likely market direction going forward. Then based on the weekly/daily forecasts, I know the likely market direction also. Knowledge: Market direction STI Trading Range for the Day Best Warrants: As you know, I like SGA warrants, now there is one trading 5-6 STI points per bid (at 0.05cents). Calculate STI value: the break point where the price will increment. Monitor regional indices which influence STI direction: HSI, SSE, Nikkei Patience: Wait for the technical indicators to give me the buy signal. Do not enter too early, enter at the righ

How a Kid With a Ruler Can Make a Million

A Lesson in Drawing and Using Trendlines By Jeffrey Kennedy Jeffrey Kennedy shares how when he began his career as an analyst, he was lucky enough to have some time with a few old pros. One in particular told him that a kid with a ruler could make a million dollars in the markets. He was talking about trendlines. Read More . TSK: Hmmm... I am planning an article - "Trendlines Make You Rich!", oops, EWI is ahead of me! Anyway, lookout for "Trendlines Make Your Rich!"

The Ultimate Technical Analysis Handbook Free!

Today more and more investors are warming to the fact that psychology moves markets and therefore fundamental analysis, which fails to properly measure mass investor psychology, must be flawed. Who can blame them? After all, fundamental analysis -- based on past company earnings, rating agency projections and the like -- proved to be of little value during the bust. There is a better way. Many investors who monitor investor sentiment readings, study Elliott wave patterns and employ other powerful technical indicators were -- at very least -- able to position themselves to survive the recent decline. Still others were able to turn crisis into opportunity and profit from the volatility. How'd they do it? Technical analysis. You see, technical indicators remove the cloudy, bias-driven assumptions from your analysis and focus on the one thing that moves markets: investor psychology. Past performance is not indicative of future results -- and that's where fundamental analysis goes w

September 21 Weekly Update - Stock Market Forecast

September 21 Weekly Update - Stock Market Forecast Fengshui: Market likely to be slow and weak. Financial Astrology : Can the Bullish Planets continue to support the markets? Who will win the battle? Bullish Planets or Bearish Planets? Technical Analysis : US indices – Direction uncertain for Monday. This week is FOMC meeting again.

Forecasting Business & Stock Market Cycles with Moon

Image
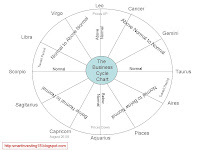
Do you know we can forecast the Business Cycle and Stock Market Cycle using the Moon? Yes, the Trend of the Business and Stock Market Cycles corresponds with the Moon Cycle! The Moon has a North Node (called the Dragon Head) and a South Node (called the Dragon Tail). A Moon Cycle takes 19 years, i.e. it takes 19 years for the Moon's North Node to pass through the 12 zodiac signs. Other sources say it is a 18.6 year cycle. Hmmm..... most important of all, if we know the zodiac sign where the Moon's North Node is in, we will know the Trend of the Business Cycle, and then the Stock Market. See Business Cycle Chart (click to enlarge). Oops! It is more complex than this. Other Heavenly Bodies (Planets) also got strong influence on the Business and Stock Market Cycles. Like Saturn and Uranus. These can depress or expand the business cycle and affect Stock Market prices also. Wow! Now I know why the Stock Market is 6 months ahead of the Business Cycle. The Moon&

EWI's World-Famous FreeWeek is Back!

Our friends at Elliott Wave International have just announced the beginning of their wildly popular FreeWeek event, where they throw open the doors to some of their most popular paid services to non-subscribers for one week only. For the first time ever, EWI is providing complete access to The Asian-Pacific Short Term Update and The European Short Term Update , but only until Sept. 23 . Markets move fast, so having an independent forecasting and near-term opportunity-spotting service on your side is more important now than ever. FreeWeek lets you see for yourself, and each day for one full week will show you clearly labeled price charts with updated analysis of all the major equity markets in the European and Asian-Pacific regions. If you’re not taking part in EWI’s Asian-Pacific and European Short Term Update FreeWeek right now, you’re already missing the valuable opportunities your peers are getting for free, and FreeWeek only lasts from now until noon Wednesday, September 23.

Robert Prechter's Five Tips for How To Trade Successfully

Take it from the person who won the United States Trading Championship with profits of more than 440% in 1984 – there are five things that every successful trader needs to know how to do. Read More .

September 14 Weekly Update - Stock Market Forecast

September 14 Weekly Update - Stock Market Forecast Fengshui : Market likely to be weak Sept 14/15, might see strength on Sept 18, 2009. Financial Astrology : Saturn Uranus Opposition can coincide with a crisis. Mercury retrograde relates to “fake-out” in breaking support or resistance. Expect a very bizarre market in next couple of weeks. This week also have Bullish Planets in the Sky. Who will win the battle? Bullish Planets or Bearish Planets? Sept 18 is middle of Mercury Retrograde, sharp reversals often happen. Technical Analysis: US indices – likely to decline Monday. This week is the quarter’s quadruple-witching expirations week in US markets. Have you read the Voyage to the Bottom of the “C” ?

Voyage to Bottom of the “C”

Image
Have we reached “Sea Level”? When will we start the next Dive in the Voyage to the Bottom of the “C”? Below is a list of possible Dates that DOW might have reached “Sea Level” (Phase 2 Top) or start of the Dive (Phase 3): September 11 2009 – Oops! After accounting for error made in estimating the 1.5 weeks notice that Heaven shall give, this should be the likely start date. This also coincides with the September 11 2001 Stock Market Time Cycle and Pluto direct. Wah, also coincide with Stock Market Time Cycle Model – Formula 1. September 14/15 2009 – Saturn Uranus Opposition September 16 2009 - 28th day of 7th Lunar Month per study done by an expert September 18 2009 – New Moon. Fibonacci 0.382 of Time Wave travelled by Wave A. This is also the Jewish New Year! Middle of Mercury Retrograde Cycle. September 21 2009 – Start of Fall Equinox. Fibonacci 0.382 of Time Wave travelled by Wave A (rounding up). It's a Holiday in Singapore, Muslims New Year on September 20 200

DOW Back to September 11 2001 Level!

Image
“Gone nowhere in 8 Years!” “Eight years have now passed since 9/11, and the Dow is essentially unchanged since that horrible, sad day. On 9/11/01, the Dow was at 9,605.51 ” (Source: B.I.G.) Guess what was the closing value for Dow on September 11, 2009? 9605.41! Wow! Ting Ting Ting! I quickly did some research and calculations using my Stock Market Time Clock. Hmmm.... guess what I discovered? Lookout for my next article before end of today!

Free 47-Page eBook: How to Spot Trading Opportunities

What if you could look at a chart and instead of seeing what happened, you could see the potential trading opportunities that could happen. Elliott Wave International (EWI), the world’s largest market forecasting firm, has just released a free eBook to teach you exactly that. The How to Spot Trading Opportunities eBook features 47-pages of easy-to-understand trading techniques that help you identify high-confidence trade setups. Senior EWI Analyst Jeffrey Kennedy will show you how some of the simplest rules and guidelines have some of the most powerful applications for trading. Created from the $129 two-volume set of the same name, this valuable eBook is offered free until September 23, 2009 . Don’t miss out on this rare opportunity to change the way you trade forever. Go here to download it now . About the Publisher, Elliott Wave International Founded in 1979 by Robert R. Prechter Jr., Elliott Wave International (EWI) is the world's largest market forecasting firm. Its staff of

This Is It 09-09-09?

What day is September 9, 2009? 09-09-09 Invert it, what do you get? 666! Oops, the Number of the Beast! If August 27, 2009 is the Top of this Rally (US Markets) , then add 1.5 weeks (exact notice period that Heaven shall give) , we get September 9, 2009! Wow! Will Markets start to drop from this day onwards, with the "crash planets" ahead? Let's watch!

How A Bear Can Be Bullish And Still Be Right

In recent months, Elliott Wave International President Bob Prechter has become something of a household name. In the final two days of August 2009 alone, Bob was mentioned by several news outlets from MarketWatch to the New York Times. The claim to his "fame"-- Read More .

September 7 Weekly Update - Stock Market Forecast

September 7 Weekly Update - Stock Market Forecast Fengshui : Market likely to gain strength, volatile first half and stable second half. Financial Astrology : Saturn Uranus Opposition can coincide with a crisis. Mercury retrograde relates to “fake-out” in breaking support or resistance. Expect a very bizarre market in next couple of weeks. Technical Analysis: US indices – Monday is a holiday. Tuesday likely to decline. Read September 2009 Stock Market Forecast . Read Will September Markets be Bullish.

Will September Markets Be Bullish?

Below is summary of key points extracted from an interesting US newspaper column published on September 4, 2009, written by a market timing expert: The market has done quite a job of ignoring its history so far this year. January and February, usually positive winter months, it experienced a sizable loss of 25% . In historically favourable period, not launching into a sizable rally until March. Defying its historical “Sell in May and go away” history, the rally continued to roll right through May. It did decline for four straight weeks beginning in June, following its history of “If May doesn’t get you, June will”. The rally then resumed in July, also not unusual, as there is usually a minor summer rally. But the summer rally continued through August, the first month of the market’s historically worst three-month period of August, September, and October. That has a lot of people claiming that since the historical patterns have been off so much so far this year, they will therefore be

September 2009 Stock Market Forecast

September 7 to October 7, 2009 The Yin Water Rooster is another strong Water Month. First half shows mixed and confusing energy, while second half show strength of metal energy. Gold and Oil prices are likely to fall. Favourable industries/sectors: Water and Wood Financial Astrology: Many Bearish Planetary alignments this month: Mercury retrograde - September 6/7 to September 29. Saturn Uranus Opposition – September 15. Expect the unexpected. The last time this occurred, Dow dropped more than 2000 points. This date is also the anniversary of Lehman Brothers bankruptcy. Will there be another banking crisis? Pluto turns direct – September 11. This date is the anniversary of 911. Will there be another terrorist attack? Or pandemic disease (biological war)? Expect high volatility this month, especially second half. If there is any bubble, it might burst this month. Will Jupiter and Neptune help keep the market positive? Technical Analysis: US Market: Phase

Asian Stocks Poised for Steep Correction

Have you read the latest Elliott Wave International's Asian-Pacific Financial Forecast (APFF) report released on August 28, 2009 ? Below extracts of what was reported in Bloomberg yesterday, August 31, 2009, based on the APFF: Asian stocks are due for their “largest correction” since rallying from their March lows as the region’s major indexes complete “intermediate tops.” The benchmark MSCI Asia Pacific Index has climbed 62 percent from a more than five-year low on March 9 on speculation stimulus packages and lower borrowing costs will revive the global economy. Australia’s S&P/ASX 200 Index looks “bearish” because it has advanced for three-consecutive waves. “That puts it most at risk of a deep retracement.” China’s Shanghai Composite Index and South Korea’s Kospi Index are “breaking down.” The Chinese gauge was the world’s best-performing major index until it peaked at 3,478 on Aug. 4, after a five-wave rally that began in October. The weakness in the