Posts

Showing posts from November, 2011

Trust Bank Singapore, New Digital Bank Freebies!

Image
Have you applied for your Savings Account or Credit Card with Trust Bank Singapore, Singapore's digital bank backed by a unique partnership between Standard Chartered Bank, and FairPrice Group? REFERRAL CODE: BZACYE0F ( it is a number zero, not letter ) Get $35 worth of free Fairprice vouchers and other freebies by just Downloading the Trust App and Open a Savings Account online with the App, simple/easy within 10mins!: Get free $10 Fairprice E-voucher (no minimum spend at stores/online) by entering this code ( BZACYE0F ) when apply for the Savings Account. Get free 1kg Fairprice Rice voucher Get free Kopitiam Breakfast Toast Set voucher Charge one transaction to your debit card to get free Fairprice $25 voucher (no minimum spend, at stores/online). Hack: Do a funds transfer of $1 or $10 from your own bank to Trustbank savings account. Then Just add your debit card number to Grab App, authenticate with $1 charge/refunded to your saving...

Shanghai Composite Leading Next Leg Down!

Wow! Its Shanghai Composite Index Again! It is feeling the effects of the "Planetary Formation" in the Sky now, down more than 3% so far today (it is still trading 2.16pm)! Or is it because of a Sell Call on China Stocks issued by Goldman Sachs November 29 2011? Hang Seng Index is following! Will DOW be next tonight? Watch!

STI Megaphone Top Update

Image
Wow! Do you remember when I first warn about STI's Bearish Megaphone Top - Danger Ahead? I forgot about it and never follow up or monitor! S---! Here is the updated chart of the STI Megaphone Top. "A Picture is worth a thousand words" Are you still trying to pick bottom or "catch the falling knives"? Watch the Strong Daily Down-Trend Channel! Unless STI can breakout and close above the strong resistance lines, you are catching the falling knives! Beware of false breakouts!

Stock Market Forecast December 2011 (Panic Crash Ahead)

Haha, if you have been reading my recent articles, you already know the Stock Market Forecast for December 2011. WD Gann said "Forewarned is Forearmed"! That's the benefit of Stock Market Forecasting using "the right methods" = the WD Gann Secrets of Stock Market Forecasting! Time is the Most Important Factor! So have you read my recent articles which are still in play: 1. Stock Market Forecast October -November 2011 . The waves have extended to December 2011. 2. DOW Megaphone Bottom 1987 Like Panic Crash 3. Panic Crash Cycle Ahead 4. DOW's Black Swan Dive Ahead 5. STI Falling 3 Peaks History Repeats . Downside Target Might be worst! Today, "chng-kay" seems to be holding STI at the neckline (2677) since opening (more than 2 hours already). How long can they continue to hold it? Let go and STI will dive!

STI Falling 3 Peaks - History Repeats?

Image
A picture is worth a thousand words! Did you notice the Straits Times Index has a Falling 3 Peaks Pattern? Falling 3 Peaks Pattern is also found in the Hang Seng Index, S&P, Nasdaq, etc. Hang Seng Index broke/close decisively below the lowest of the 3 Peaks' valley, you saw what happened? Did DOW, S&P500 and Nasdaq break/close below the lowest valley last night? Watch for Straits Times Index to break and close below 2754, the lowest of the 3 Peaks' valley, then see what will happen? Watch the Possible Repeating Pattern? History Repeats?

Shanghai & Hang Seng Index Leading the Crash?

"Lai Liao Lai Liao"? Is Shanghai Composite Index leading the Crash? Hang Seng Index is following already? Did you hear any news? Its the USD rally? Is DOW next tonight? The signal is in the SKY!

Looking Back 20 Years - DOW Dive 3.9%

What happened today in History? DOW dived 3.9% on November 15 1991. What happened? Will history repeat?

DOW's Black Swan Dive Ahead?

Image
Haha! There you go again! Forgot to put the pieces of jigzaw puzzle together again! Last night, I decided to input the November 11 1918 date into my Stock Market Time Clocks. Bingo! It gave one of the most important date in DOW's history: July 8 1932! Let's do a 4-D bet! Haha! (Do you know what 4-D stand for: Debt, Deficit, Default, Downgrade!, haha). The Maths for November 11 1918 to November 11 2011 I shared yesterday is indicating a possible end of cycle. So it should be a TOP in DOW! Last night, I was staring at the DOW 60 minute chart. I saw this pattern and decided to draw a trend line. This morning I checked. True enough, it hit the trend line and continued to trend below it till closing, in every time frame. What was that pattern? Its a possible completion of Triangle Pattern! Look at the DOW Chart below. Does it look like a Black Swan Formation? What does a Black Swan do? BLACK SWAN DIVE! A picture is worth a thousand words! What could happen over this wee...

November 11 2011 Stock Market Crash?

Last night, I was searching the internet for some information and found this: November 11 1918, end of World War I. Wow! That is exactly 93 years ago from today, November 11 2011! Today, I suddenly have this "Food for Thought", just thinking out loud: 1. 80+13 = 93, wow! 13 year cycle? 2. 18.6x5 = 93, wow! 18.6 year cycle? 3. 19x4 + 17 = 93, wow! 17 year cycle? 4. 5x666 = 93, wow! 666 day cycle? Wow! What could happen today? Will LAO TA (Mr DOW) kick off Wave 3 of 3 of 3? KILLER WAVE! Today, Straits Times Index seems to be floating at Wave 2 of 3 of 3, waiting for Hang Seng Index to pull the trigger? Haha, this is not part of my forecast, but will be incorporated if it works! Lookout for my next interesting article: "How to forecast the future direction of Hang Seng Index, DOW and Straits Times Index using the Shanghai Composite Index as Crystal Ball! "

History Repeats - STI Double Top Warning?

Image
Haha, sometimes it does not help to do double confirmation? Analysis Paralysis? The more research I do, the more confuse I get? No No No! It is because I failed to piece together the jigzaw puzzles. I'm overwhelmed by each piece of research, overjoyed when I discover the secret of each piece, then failed to merged the pieces together for the final results. But the best piece is still my "Straits Times Open Book". But it is a "Long Term forecasting model ", although it had been quite accurate short term. So what does it tell? "Watch for a possible double top November 9-11, that should end this rally and start the next major decline."

Panic Crash Cycle Ahead?

Be careful! There is a potential Head & Shoulder Forming in the 10-min Charts of DOW and Straits Times Index. If the decline from OCt 28/31 Top is wave 1 down and yesterday's strong rally wave 2 up, should markets drop today, that could be start of wave 3 down. Should the right shoulder of the H&S pattern complete and the neckline is broken, haha, guess what will happen? I updated my Stock Market Time Clocks late last night, with important dates from my research of the past 30 plus years of data from Watching the Sky for Trends. Wow! Most important discovery of all time. I'm still working on it. Guess what will happen November 4? Another "Black Day" in Stock Market History? Let's watch. This is the first time I'm using this formula. I keep my fingers crossed! I'll share more if it occurs.

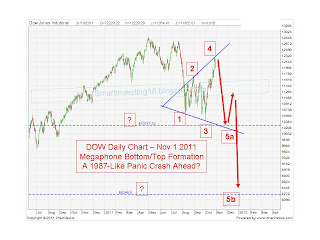
DOW Megaphone Bottom 1987-Like Panic Crash?

Image
Did you notice this Bearish Pattern Formation in the DOW Chart? A Megaphone Bottom or Top! According to experts, you can project the target downside or upside (if you are bullish) using a simple formula. I'm bearish. Using the formula, measure the difference between points 4 and 5a, then subtract this difference from point 5a = projected target downside 5b. Wow! Can you see what is my projected number for DOW? But first we need to wait for the pattern to complete at 5a to get the actual number. Wow! My additional deep research into the past 30 plus years of data "Watching the Sky for Trends" indicates a possible Panic Crash Like Pattern of 1987! Another Flash Crash? A Waterfall, Sharp Decline Ahead? Provided my calculations are correct and my interpretation of the formula is correct! This is the first time I'm attempting to forecast using this formula! According to WD Gann, Time is the Most Important . When Time is Up, Prices will Fall or Rise! (Note:Chart ...