Posts

Showing posts from April, 2009

Trust Bank Singapore, New Digital Bank Freebies!

Image
Have you applied for your Savings Account or Credit Card with Trust Bank Singapore, Singapore's digital bank backed by a unique partnership between Standard Chartered Bank, and FairPrice Group? REFERRAL CODE: BZACYE0F ( it is a number zero, not letter ) Get $35 worth of free Fairprice vouchers and other freebies by just Downloading the Trust App and Open a Savings Account online with the App, simple/easy within 10mins!: Get free $10 Fairprice E-voucher (no minimum spend at stores/online) by entering this code ( BZACYE0F ) when apply for the Savings Account. Get free 1kg Fairprice Rice voucher Get free Kopitiam Breakfast Toast Set voucher Charge one transaction to your debit card to get free Fairprice $25 voucher (no minimum spend, at stores/online). Hack: Do a funds transfer of $1 or $10 from your own bank to Trustbank savings account. Then Just add your debit card number to Grab App, authenticate with $1 charge/refunded to your saving...
Free EWI Global Market Forecasts April 2009

Great news! Due to thousands of downloads and tremendous demand, Elliott Wave International has agreed to extend free access to their global forecasts until May 8. If you missed out on the original offer, now is your chance to get more than 100 pages of free analysis and forecasts on every major world market. For the first time ever, EWI is giving away one month of its most popular global analysis publication, a 120-page "little black book" of investment insights called Global Market Perspective, which includes EWI's three regional publications: The U.S. Elliott Wave Financial Forecast ($19/month value) The European Elliott Wave Financial Forecast ($29/month value) The Asian-Pacific Elliott Wave Financial Forecast ($31/month value) PLUS, the 120-page book includes analysis culled straight from EWI's professional-grade Specialty Services, each of which is valued at $199/month. This means you also get analysis and forecasts for the following global markets: World stock...

SARS vs Swine Flu S&P 500 Charts

Image
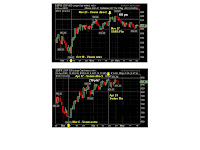
SARS vs Swine Flu S&P 500 Charts Wah, so eerie! Look at the S&P 500 Charts of 2002 vs 2009 noted by one Astro Expert! In 2002, Venus Retrograde, market crash before retrograde, then rally till venus direct, then go sideways. Then SARS news, market start to decline. Now, in 2009, looks like history repeated! Well, at least for Venue Retrograde! Will it continue to “mirror” the chart pattern of 2002? Will S&P decline significantly tonight, like in 2002 (see the big red candle)? Tonight got market breaking news hor! Then another astro expert say don't trade, its a bad day! Wonder what will happen? Let's watch!

April 27 Weekly Update - Stock Market Forecast

April 27 Weekly Update - Stock Market Forecas t Fengshui: Market likely to be slow, might gain strength second half of week Financial Astrology: Will the decline start this week? Technical Analysis: US indices – might decline Monday, might start next wave done. A fairly large schedule of potential market moving economic reports this week: Consumer confidence (28 April), FOMC (28/29 April), Q1 GDP (29 April), Weekly Jobless Claims ( 30 April). One astro expert said avoid trading on April 29, 2009. Hmmm... wonder what might happen? Then there is another planet retrograding next week. This planet is known to have negative influence on the stock market. Would it's scheduled retrograde start its negative power this week? Then there is the swine flu wave! Wah, is it going to be a volatile week!

Sell in May, Don't Go Away!

Still remember the Halloween Indicator ? Sell in May, Go Away ? Best Six Months Investment Strategy? Yes, the MACD SELL Signal had been triggerred! Dow on April 21, 2009 S&P on April 21, 2009 Nasdaq – only look for SELL Signal in early June, Best Eight Months apply! Consider selling and lightening up long positions on rallies. A test of March Lows is likely. Source: Stock Trader's Almanac Investor Alert So, Sell in April, Don't Go Away! Says Who? Me! TSK! Based on My Crystal Ball! Fengshui Forecast, Financial Astrology Forecast and Technical Analysis based on Elliott Wave! Oops... me too bullish ahead? Lookout for May 2009 Stock Market Forecast!

Dow Leads Asia, Who Leads Dow?

Image
Dow is one of the Leaders in the Global Stock Market direction. Then who leads Dow? If we know, it would certainly help us “manage the future” direction better. Wow, “manage the future”, not predict the future! Says who? Says Daryl Guppy! I attended a free talk by Daryl Guppy recently. That was the best I've ever attended on how to read market directions, ie where is the market heading? So who leads Dow? According to Daryl Guppy, who posted his analysis yesterday, watch the behaviour of NASDAQ , the leading market index in America! Now then I know, the real “Lau Ta” (Big Brother) is Dow's “Lau Ta”, Mr NASDAQ! Summary of key points: 1. NASDAQ index has developed new and stronger uptrend many weeks before DOW began to move. 2. The new trend in NASDAQ index is more developed than the trend in DOW. 3. Watching the NASDAQ index gives a leading indication of how the American market will develop and the way it will react when resistance levels are encountered. 4. There are two import...

Direction of Dow April 22, 2009?

Where will Dow be likely to head next tonight? Yesterday, Astro gave a reversal signal. I did not know how to read it. After Dow rebounded last night, then the reversal meant rebound from Monday's drop. Today, Astro is showing another reversal signal. So, would Dow be down tonight? Based on TA, Dow would likely be down tonight. Then we have New Moon coming April 23 to 25, 2009. Would it be down or up? According to another Astro Expert, tonight will mark the top or bottom of Dow. So would Dow be up or down tonight? What would be the short term trend going forward? We would likely know by tomorrow?

April 20 Weekly Update - Stock Market Forecast

April 20 Weekly Update - Stock Market Forecast Fengshui: Market likely to be slow/weak, signs of volatility April 23, 2009. Astrology: April 17 likely marked the top. Will markets reverse? Will lows of Mar 6-10 hold? Or will market continue to struggle upwards? Technical Analysis : US indices – Markets can go either way, watch first few days for guidance. When ambiguous, best to stand aside and let the market find its direction. (Afternote at 10am - Looks like Asia kicking off the reversal. Today, Astro displays a high probability indicator that Dow might reverse tonight. Let's see how reliable)

April 2009 Global Market Outlook

I was at ATIC 2009 the whole day. Very fruitful trip. Obtained some information on Global Market and Singapore Market Outlook. So only managed to finish reading the 120-page April 2009 Global Market Perspective – freebie from EWI during this FreeWeek Event - during this late hour. I only read those sections of interest to me. Have you obtained your free copy ? Dun missed out on : Where is DOW, S&P500, STI, Hang Seng, China Shanghai Composite, Nikkei, Australia, Taiwan, India, Korea, Europe, etc heading? Where is Gold heading? I've been waiting for this level to come before considering buying. Where is Oil heading? And many more! There is also a summary of Elliott Wave Principle. “Elliott Wave Principle does not provide certainty about one market outcome. It provides an objective means of assessing the relative probabilities of possible future paths for the market.” Hurry! This offer ends soon. For a limited-time, you can download a 120-page book full of investment analysis and...

April 2009 EWI Global Market Perspective Report Free!

Once each year or so, our friends at Elliott Wave International do something unheard-of in the world of financial analysis – they give it away for free! But it always ends soon after it starts, so your time to get more than 100 pages of free analysis and forecasts on every major world market is running out. This time they've upped the ante. For the first time ever , EWI is giving away one month of its most popular global analysis publication, a 120-page "little black book" of investment insights called Global Market Perspective, which includes EWI's three regional publications: The U.S. Elliott Wave Financial Forecast ($19/month value) The European Elliott Wave Financial Forecast ($29/month value) The Asian-Pacific Elliott Wave Financial Forecast ($31/month value) PLUS, the 120-page book includes analysis culled straight from EWI's professional-grade Specialty Services, each of which is valued at $199/month. This means you also get analysis and forecasts for the f...

MM Lee on US Economy Recovery Mid 2010!

"The depressed American economy might turn around starting from the middle of next year and that is when the world will start climbing out of recession.” MM Lee said yesterday. "I take it with a pinch of salt. They (referring to Ben and Timothy) must sound optimistic or they will make the market more pessimistic.” MM Lee said. Source: extracted from Straits Times, April 17, 2009 He was commenting their remarks that “US economy will pickup by late this year or early next year” Hmmm... I'm very impressed with his foresight, his forecast on the Singapore and US economy! Do you know it is n somewhat in sync with some forecasts made by Fengshui Masters and Financial Astrology Experts? I'll share with you when the time is right!

Second Warning by MM Lee on Singapore Economy!

Minister Mentor Lee Kuan Yew said at an event in Hanoi: Singapore's gross domestic product could shrink 10% this year if the island-state is "unfortunate." If we are unfortunate, it will be minus 10%. But in the same way as we go down rapidly, when the recovery comes, we will go up rapidly because we are very globalized. This is the second time that Mr Lee had said that the island's economy could shrink by as much as 10% this year. Earlier this week, the government revised its GDP expectations for the year to a contraction between 6% and 9% from a 2% to 5% fall previously. Source: Extracted from DJ Newswire, Friday April 17, 2009 Wah, is he hinting bubbles are building in the Stock Markets? Did you notice the first big bubble in China Stock Market? It is now signalling a potential bull market. Or is it the powerful force of Venus retrograde, giving false signals? Will it be the first to burst? Just thinking out loud!

Where STI Bear Market Rally Heading?

Image
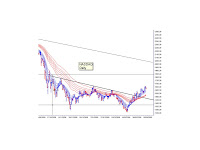
Daryl Guppy wrote an analysis on STI on April 15, 2009. Key points to note: STI within a trading band, a pattern of rally and retreat behaviour. The same is observed in the Hang Seng Index. Lower band near 1460 is support level, not well tested, act as rebound point. Upper band near 1940. Successful breakout sets upside target near 2400. Probability of breakout near term is low. Middle area of trading band is near 1750, act as support. If 1750 holds, the rally and retreat behaviour will remain in the upper half of trading band. Probability is high. Failure to hold confines the rally and retreat behaviour to the lower half of trading band. This extends the duration of the consolidation period. Do you notice a possible Rounding Top Pattern forming in STI? Read Where DOW & S&P500 Bear Market Rally Heading ?

Where Dow and S&P 500 Bear Market Rally Heading?

Image
Do you notice a possible Rounding Top Pattern forming in DOW and S&P 500 Charts? Noted by one TA expert. A Rounding Top Pattern is a consolidation and distribution pattern. Consolidation occurs when a downtrend slows: Prices cluster, or hover, near a particular price level. Price stops falling. The consolidation period is usually a narrow trading band. Prices has small rallies and small retreats. The trend is sideways. Consolidation in a downtrend is a signal that accumulation is developed. In an uptrend, consolidation also develops as a narrow trading band. This is not called consolidation, but has the same features. The price activity stops trending upwards and moves sideways. This is a signal that distribution is developing.” " Distribution occurs when early buyers decide to sell the shares they have accumulated. As the price rises, they offer their shares for sale. As more and more shares are offered, it becomes more difficult for the price to continue rising. This dis...

Venus Station and Financial Markets

April 14, 2009 - Venus is now stationary April 17, 2009 - Venus turns direct. "In financial markets, a Venus station is the indicator of a reversal. Usually it takes about a week before the impact is noticed in the Indices." "Take profits before Venus turns direct" Wow! Means must wait patiently to see what's going to happen. Think capital preservation, protect against downside risk!

Recall Fengshui Stock Market Predictions 2009

Still remember my article published in January 2009 – More Fengshui Master Predictions 2009? Read these again: Hong Kong Fengshui Master: "Financial markets will go up a little in the first couple of months but this will be short-lived. Investors are bound to be disappointed in the end." Malaysia Fengshui Master: "There will be a little spring appearing in mid-2009, which is a false image. People will think this spring marks the start of a rally. Things will in fact go down after that. My advice is for investors to ride on the wave of this little spring when it happens. Use this opportunity to sell. " Remember, by mid-2009! For now, read 3 Phases (Legs) of Bear Market and my Monthly Crystal Ball for additional tips!

April 13 Weekly Update - Stock Market Forecast

April 13 Weekly Update - Stock Market Forecast Fengshui: Market likely to slow down. Astrology: Markets might reverse suddenly, short and sharp when Mars to Saturn/Uranus Opposition end on April 15. Venus ends retrograde and turns direct on April 17 - high probability of trend reversal. Technical Analysis : US indices – Significant turn coming soon, +/- 50% decline. Be careful! This week is Options Expiration Week in US, where big players bully small players. Guess what could happen! Then there are important earnings release – Goldman Sach (14), JP Morgan (16), Citigroup (17). Also Retail Sales and CPI (14), Fed Beige Book (15)

Prepare for Next Bull Market?

Make a wish, TSK, on this April 11, a day always remembered by third parties . Be prepared for the next Bull Market! Be prepared to ride each mini-bull run as well, I mean Bear Market Rallies, during this Bear Market which would likely last 4-6 years. 2 days ago, I found this expert resource sharing secrets to successful investing – on how to prepare for the next Bull Market. I did some research and found a reliable indicator that could signal we are close to the bottom of the bear market. It might also be used as warning of potential downturn or bear market. Steps to Prepare for the Bull Market: Wait till we enter Phase (Leg) 3 of the Bear Market Monitor the “C” Indicator for signs we are close to bear market bottom Monitor Unemployment trend Monitor key technical indicators on indices for signs of reversal to bull market Look for uptrending stocks to buy Take positions in uptrending stocks, in phases Monitor for signs we are close to end of bull market, sell progressively. Oops, al...

Signs of Stock Market/Economy Recovery?

Image
According to Stock Trader's Almanac, the Dow tends to bottom when Unemployment peaks. Unemployment Rate and the Dow move in a highly correlated inverse direction. "Unemployment is a lagging indicator that moves inversely with equity prices. The chart shows the pattern of unemployment, recessions and the real (inflation-adjusted) price of the S&P Composite since 1948. Note the increasing peaks in unemployment in 1971, 1975 and 1982. The inverse pattern becomes clearer when viewed against real (inflation-adjusted) S&P Composite, with its successively lower bear market bottoms. The mirror relationship seems to be repeating itself with the current and previous bear markets." Source: See Chart So, lookout for a sharp reversal in the Unemployment Rate for a clear signal the market is ready to take off. Be cautious with data/information!

Secrets to Successful Investing/Trading

The Stock Market is like a Financial War between Institutional Players and Retail Speculators. Institutional Players have unfair advantage over Retail Speculators as they have industry knowledge and size. Beware of these Sharks and Piranhas when you are in this Financial War. How can we beat them or win this Financial War? Apply the Sun Tze Art of War ? The Secret to Successful Investing/Trading is know your 3 M: Method: Knowledge. Know your edge. Do you have one? Do you have a trading edge to increase your chances of success, to put probabilities on your side? There is no 100% sure win, you don't need 100%, you can be wrong and will experience losses. Listen to the Market. Know the Trend. Money Management: Focus on long-term survival as top priority, then steady growth of capital and lastly making high profits. Know the consequences. If wrong, cut! Mind: Mental ability to execute other 2 M. Strike a balance between Fear and Greed. Fear = precaution, focus on risk not returns. G...

Move Funds to Earn Higher Interests!

So disappointed with DBS for dropping the interest rate for Mysavings Account to 0.60%. No use being a Treasures Priority Banking (TPB) Customer liao! Also lose the 1% interest! So moving my funds to another Bank which can offer me more than 1% p.a. Interest on Fixed Deposit (ha ha joint account with senior citizen lor!). Better to lock in the interest rate! Also must remember to withdraw from TPB, otherwise a monthly fee will be charged! And must remember to transfer all funds in the CPF Investment Account back to CPF fast. Interest with CPF is so much higher than keeping the funds in the CPF Investment Account! Wow, did not know can do it via ATM now. If not, the bank will only do it for you 2 months later if your CPF Investment Account is inactive. Wah, that is a lot of interest loss!

3 Phases of Bear Market (Part 2)

The most read article is Stock Market Forecast 2009 – Yin Earth Ox . Have you read? When will this Bear Market likely to e nd? Have you read? So do you still want to pick the bottom? Do you still want to buy and hold? Applying the Art of Foresight , it might be safe to pick the bottom. Then buy and hold, and exit before the Bear Market Rally ends. Hmmm... Art of Foresight? Fengshui Forecast! Financial Astrology Forecast! Elliott Wave Analysis! My Crystal Ball! There is no 100% certainty. Otherwise, nobody would be working, nobody would be providing services! Elliott Wave Analysis (EWA) ? In Part 1 , EWA indicates we might be in Leg B of this Bear Market. Markets do not drop or rise in a straight line. Leg B would likely be in 3 waves (a-up, b-down, c-up). One TA expert forecast US indices should be in b-down soon, which should correct 50% of this rally, followed by c-up. But what if b-down take out the low of March 9, 2009? One FA expert forecast this down leg might break the March 9,...

April 2009 Stock Market Forecast

April 5 to May 4, 2009 This is the Yang Earth Dragon month. As earth energy is extremely strong, markets likely to slow down. Sluggish first half, volatile second half which might result in more losses. Favourable industries/sectors: Wood and Earth Week of April 6, 2009: Markets likely to be volatile, some strength on April 9, 2009 Technical Analysis : Uncertain whether Fibonacci turn window (April 6 to 15) will be a top or bottom. Wave b up might have topped or will be topping. Next is Wave c down which might correct 50% of the rally. Financial Astrology: Potential market reversal April 5 to 15. Following are key planetary movements with potential impact on stock markets: Pluto turns retrograde April 4th. It indicates a market reversal 75% of the time. Venus square pluto April 3 and May 3 Mars touch Saturn and Uranus opposition April 4 to 15. In 2008, sharp declines in stock market occurred. Will history repeat? Venus turns direct on April 17, often marked market turns +/- 10 days. F...