Posts

Showing posts from July, 2009

Trust Bank Singapore, New Digital Bank Freebies!

Image
Have you applied for your Savings Account or Credit Card with Trust Bank Singapore, Singapore's digital bank backed by a unique partnership between Standard Chartered Bank, and FairPrice Group? REFERRAL CODE: BZACYE0F ( it is a number zero, not letter ) Get $35 worth of free Fairprice vouchers and other freebies by just Downloading the Trust App and Open a Savings Account online with the App, simple/easy within 10mins!: Get free $10 Fairprice E-voucher (no minimum spend at stores/online) by entering this code ( BZACYE0F ) when apply for the Savings Account. Get free 1kg Fairprice Rice voucher Get free Kopitiam Breakfast Toast Set voucher Charge one transaction to your debit card to get free Fairprice $25 voucher (no minimum spend, at stores/online). Hack: Do a funds transfer of $1 or $10 from your own bank to Trustbank savings account. Then Just add your debit card number to Grab App, authenticate with $1 charge/refunded to your saving

Happy Blogiversary Celebrations with TSK!

Image
"So this is July 30, 2009 And what have I done For ONE Year is over And a NEW one just begun So this is my Blogiversary! I hope you have “fun” With my Beat Market & Investment Tips! Avoid Crashes and Ride Rallies! A very Merry Blogiversary! My Blog's Happy Birthday! Let's hope to make more money Without any fear ... Till Bear War is Over!” (sing to tune of Happy Christmas, War is Over! So this is Christmas....) So what have I done ? A Blogobook of Beat Market and Investment Tips to ride the “ Voyage to the Bottom of the C ”! Found Formula to Forecast Stock Market Turns – Timing Stock Market is Possible! Apply Elliott Wave Principles for Forecasting – Elliott Wave Make You Rich Research on Planets that create bubbles and cause crashes An exploding blog readership with 386 articles on Beat Market and Investment Tips and Forecasts (see diagrams) A Blog with potential “ Market Value ” - Thanks for your $upport reading the adverts! With your continued $upport, together we

Lunar Eclipse August 5 2009 & Stock Market

Finally, the crash came! I'm referring to my PC. It crashed this morning after a few months of ups and downs. I just dun know what was the problem but my nephew suspected the hard disk is going to crash. So I was prepared, doing periodic backups of my documents but did not backup the past few days' work. Luckily, my documents are stored in D: drive. I managed to reinstall the system which wiped out my C: drive. But my nephew warned it might crash again if the hard disk has problems. Hmmm....so now I can complete this article. Do you know why Stock Markets world-wide rallied so madly recently? Now most people are talking of a new Bull Market! The worst is over! It's all due to the heavenly factor. Look to the Sky for Trends. The planets out there create the optimism, hopes, dreams and illusions, creating the Stock Market Bubbles. Only after the bubbles are big then they will burst. And the time to burst/crash will be when those planets which cause pessimism, reality, etc app

July 27 Weekly Update - Stock Market Forecast

July 27 Weekly Update - Stock Market Forecast Fengshui: Market unlikely to show strength. Expect high volatility on July 28 and 31. Financial Astrology : Caution is warranted between now and mid-August as there are multiple planetary alignments. Market is likely to reverse under such situations. Technical Analysis : US indices – wave 1 up likely to complete, next is wave 2 down. Have you read STI Elliott Wave Count - where are we now and how high can it go? Also DOW/S&P500 Elliott Wave Count now ? Note there will be a Lunar Eclipse on August 5 2009, a full moon. Guess what day is August 6, 2009? With a Lunar Eclipse occurring so close to the Solar Eclipse on July 22 2009, there might be some effects on the Stock Market. Effects if any, might occur this week. Read Lunar Eclipse & Stock Market – coming soon!

DOW/S&P 500 Elliott Wave Count & How High?

Image
We are in the same Bear Market Wave Cycle as US Markets. So guess you know the answers! Here goes the technical analysis by US TA Experts: Where are we now? (see 3 Phases of Bear Market and Dow/S&P 500 daily charts) Phase 2 of Bear Market, Wave C up. Wave 1 is due to complete, next is Wave 2 down. Wave C will have 5 waves. Once Wave C is completed, Phase 3 of Bear Market should start. How high can Dow/S&P 500 go? (See Daily and Monthly Charts) Dow: 10340 to 11500. 50% retracement = 10350. Can you see an inverted Head and Shoulder Pattern, neckline is broken, so upside target around 11500. S&P 500: 1120 to 1200. 50% retracement = 1050. Can you see an inverted Head and Shoulder Pattern, neckline is broken, so upside target around 1200. Wow! So bullish analysis and forecasts! Me not so bullish. Read my comments in STI Elliott Wave Count ! Remember the Bears were 'eaten' up in the Bear Trap set by the Bulls when the Head and Shoulder Pattern have a false breakout? When

STI Elliott Wave Count & How High?

Image
I've been reading a number of US TA Experts' analysis and Elliott Wave Count for DOW and S&P500 but cannot find any for Straits Times Index. Oops, I'm talking about free technical analysis lah! So I shall attempt to do my own technical analysis based on the methods and views of these US TA experts for US Markets. Here it goes: Where are we now? (see 3 Phases of Bear Market & STI Daily Charts) Phase 2 of Bear Market, Wave C up. 1. Wave 1 up due to complete or completed. Next is wave 2 down. 2. Alternate wave count = Wave 3 up due to complete or completed. Next is wave 4 down. How high can STI go? (see STI Monthly Chart) Estimate is 2666. Here is the maths: 1. 50% retracement =2677 2. 50 month moving average as strong resistance at 2680 3. May 2006 high as strong resistance at 2667 4. Downtrend line as strong resistance at 2670 If market sentiments continue to be bullish and heavenly factors support bullishness, then we should see the completion of 5 waves up. Otherw

STI/DOW Elliott Wave Count, Where Are We Now?

Image
< Where are we now in terms of Elliott Wave Count? How high can DOW, S&P500 and STI go? Here's an update on the revised Elliott Wave Count for DOW per the US Experts: We are now in Phase 2 of Bear Market Likely in Wave C up Wave C up will have 5 waves Wave 1 up is likely to complete Next is wave 2 down. See how the markets go for Thursday and Friday, then we will review the updated Elliott Wave Count for DOW and S&P500. What about STI? Let's see how Friday markets perform, then review the updated Elliott Wave Count for STI.

14 Critical Lessons Every Trader Should Know

Sometimes I wonder how my pals over at Elliott Wave International ever make any money -- they give so much valuable trading education away for free. I was surprised to receive an email the other day that told me they've compiled 14 of the very best lessons from their Trader's Classroom Collection of eBooks (retails for $189) and put them in one incredibly valuable 45-page report. What's more -- they're letting people download these lessons for free. Some of the most interesting chapters include: Why Emotional Discipline is Key to Success When to Place a Trade How to Use Bar Patterns To Spot Trade Setups How To Calculate Fibonacci Projections The Best Place for High-Opportunity Trade Setups You'll find several more fascinating lessons -- 14 in all -- at the link below. I highly recommend you give this free report a look – this opportunity is only available until August 10. I suggest you jump at this chance to put these essential trading lessons in your library while

Final STI Bear Market Rally Coming?

Image
Here's a summary of key points in Daryl Guppy's report on Straits Times Index, July 22, 2009: STI had moved above the upper edge of the trading band projection at 2400. This is also a very strong historical resistance level, so this move is very bullish. The next historically strong resistance level is near 2750 and there are no technical barrier to a rapid rise to this level. There is a minor shoulder resistance level near 2650 = the peak in May 2006, suggesting a high probability the market will lose momentum between 2650 and 2750. The double test and rebound from the long term GMMA indicated the growing strength and sustainability of the uptrend. The long term GMMA did not compress in reaction to this tests. This is a strong and sustainable trend – not a rally. Any retest of support near 2400 will provide an entry opportunity. Wow! Looks like a final Bear Market Rally is coming! It is best not to get too carried away with this rally. It is not a Bull Market yet. After this f

July 20 Weekly Update - Stock Market Forecast

July 20 Weekly Update - Stock Market Forecast Fengshui : Market likely to have strength on July 20 and 21, signs of slowness rest of week. Financial Astrology : Many planetary movements next 2 weeks. Again no clue on market performance given. Another astro expert forecast market likely topped July 17, likely decline from July 23, 2009 with trend change on July 22, 2009. Technical Analysis: US indices – uncertain direction for Monday. When this up wave is complete, next will be wave b down followed by wave c up. (Last week, none of the forecast was correct, technical indicators failed to forecast the market direction correctly.) Have you read Solar Eclipse July 22, 2009 and Stock Market ?

Solar Eclipse July 22 2009 & Stock Market

“Next week on July 22 2009, there will be a Total Solar Eclipse, the longest of the century. It will be felt in China and India mostly and will have a major impact. Expect the unexpected. The eclipse will last 4 minutes, it's effect for 4 years!” Wow! Wonder what will happen before, during and after this date! And for 4 years on China and India! This is a forecast by a financial astrology expert whose past few months' forecasts on the US Stock were pretty accurate. More in Weekly Stock Market Forecast – July 20, 2009! Guess you might have read or heard about the coming Solar Eclipse. There are news circulating of possible earthquakes and tsunamis. According to the Fengshui Master, if such disasters were to happen, it will likely have an impact on the stock market. Wow! Guess what I read today? Even the Technical Expert, Daryl Guppy is forecasting a possible “China Shanghai Composite Index Bubble Burst” ! He wrote an article in The Edge for week of July 20, 2009. Key points to n

Where STI Heading Next?

Image
Did you watch the free Elliott Wave Educational Video and Lessons available this EWI FreeWeek? Dive into EWI's FreeWeek Now! I watched a new Video and some educational lessons yesterday. Immediately, I recognised the patterns which could possibly tell me Where STI is Heading Next! Why did STI break new high? Will it continue to rise? Did you notice my STI Time Clock triggered a turn date on July 16, 2009 ? Yes, that was the date STI started its turn down or topped out, as confirmed in today's movement (Oops, market still not closed yet! But trading below Open!). My Winning Trading System also shows signs of potential continued decline – the technical indicators, the market psychology trading rules. Look at the STI Chart. No longer a Head & Shoulder Pattern? But a potential Double Top ? So be careful!

Head Test of Head & Shoulder Pattern

Image
Wow, here's another expert trader's view of the US Market: "It is normally very common for the market to rebound after the break of the neckline, then proceed to test the Head or middle of the Head of the Head & Shoulder Pattern. If the market fails to break above the Head, the next decline is normally quite drastic. Of course, if it succeeds, then it will fly." And here's another blogger's view, I'm impressed at the research he had done. Comparing 2009 to 2003's Head and Shoulder Pattern. See for yourself where S&P or Dow will likely to head to next, based on 2003's history! Wowie! Next week there is a special Solar Eclipse! Read its potential impact on China and India....coming soon!

The Versatility of The Wave Principle

In this classic Elliott Wave International educational video, Chief Commodity Analyst Jeffrey Kennedy demonstrates the versatility of The Wave Principle by showing you how to identify high-probability trade set-ups at-a-glance, and in any market. Watch the video and then find out how to access Jeff's current high-probability commodity forecasts FREE during EWI's FreeWeek - but only until July 22. The Versatility of The Wave Principle Get the best daily commodity picks FREE, but only until July 22 !

Spot a Pattern You Recognize: One Simple Tip for Becoming a Better Trader

The following article is adapted from market analysis by Elliott Wave International Chief Commodity Analyst Jeffrey Kennedy. Now through July 22, Jeffrey Kennedy’s daily, intermediate, and long-term forecasts for up to 18 markets are free via EWI’s FreeWeek. Learn more here Wave patterns are like beautiful women, classic cars and great art – you know them when you see them. EWI analyst Jeffrey Kennedy drives this point home during his live Elliott wave trading tutorial. It's my favorite of his tips for trading with Elliott waves. "Trade the pattern not the count," Jeffrey says. If you don't recognize a pattern at a glance, don't trade it – plain and simple. After all, your wave count can be wrong; the pattern cannot. Does that mean you must know the exact wave count at a glance, as well? No. Simply spotting a pattern you recognize is where you should start. Read More Here

S&P 500 Breaks Above Downtrend?

Image
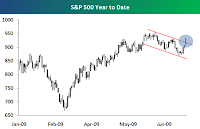
"The head and shoulders technical breakdown for the S&P 500 sure hasn't panned out this week. After breaking below the "neckline" for a day or two, the index has now shot up for 3 straight days and today it broke above the short-term downtrend channel that had formed since early June. Does this mean the index is headed back to its rally highs, or will this be another pump fake like the recent head and shoulders pattern? " (Source: B.I.G.) "Often at times when everyone has the same view of the markets and have positioned themselves in a similar manner, the market will end up doing the very opposite of what market participants expect, with this week's action in the stock market a perfect example. The S&P 500 initially broke its neckline late last week and quickly recovered this week back up to its right shoulder, and it appears as though we are currently stuck in a trading range between 870 and 956 on the S&P 500. The question now is which w

Dive into EWI's FreeWeek Now

Our friends at Elliott Wave International have just announced the beginning of their wildly popular FreeWeek event, where they throw open the doors to some of their most popular paid services to non-subscribers for one week only. Having an independent forecasting and opportunity-spotting service on your side is more important now than ever. FreeWeek lets you see for yourself, giving you top-level access and FREE forecasts for up to 18 different commodity markets on daily and monthly timeframes. If you’re not taking part in EWI’s Futures Junctures FreeWeek right now, you’re already missing the valuable opportunities your peers are getting for free, and FreeWeek only lasts from noon Wednesday, July 15 to noon Wednesday, July 22. Dive into EWI's FreeWeek Now! About the Publisher, Elliott Wave International Founded in 1979 by Robert R. Prechter Jr., Elliott Wave International (EWI) is the world's largest market forecasting firm. Its staff of full-time analysts provides 24-hour-a-da

DOW Bears or Bulls?

Image
Daryl Guppy wrote an analysis on the DOW Chart on July 14, 2009, comparing it with China's Shanghai Composite. A case of Bamboo Shoot (China) vs Green Shoot (USA) now turned yellow? I think the term “Tow Gay” is better (bean sprout)! Ha ha ha! Key points to note on Dow Chart: 1. A rounding top pattern developing in DOW. 2. The rounding top pattern is a reliable indicator of a significant trend change. This rounding top pattern is shaped like an umbrella. 3. The upper edge of the pattern is located near 8900 and the support level is near 7800. 4. The distance between the support and the peak is measured. This value is projected downwards below the support level to give a potential downside target near 6800. 5. The pattern is confirmed in two steps: The first pattern confirmation develops when the DOW is not able to move above the value of the curved downtrend line. This is currently near 8300. The second pattern confirmation comes when the DOW closes below the support level at 7800.

Anticipate Market Twists and Turns

Wow, my Straits Times Index Time Clock continued to spot every potential market twists and turns. It can also be used to time the US Stock Market (DOW and S&P500), +/- 1 day or so. I have also found the best technical tools or indicators to help identify the Turn Dates, ie will it be a bottom or top, is it just a technical rebound or a change in trend. Yes, there are so many tools or indicators in the Stock Market. Regardless of which we use, it is important we understand the strengths and weaknesses of the tools . Once we know the weaknesses, we can put in “countermeasures” to reduce the risk of loss should the weakness works against us . What do I mean by “countermeasures”? Oops! That's my Holy Grail! Who says there is no Holy Grail in Trading? No Winning Trading System? A Winning Trading System: STI Time Clock & Company A Set of Technical Indicators “Market Psychology” Trading Rules Elliott Wave Principles Chart Patterns Most important of all, PATIENCE! Wait for the ST

July 13 Weekly Update - Stock Market Forecast

July 13 Weekly Update - Stock Market Forecast Fengshui: Market likely slow down. Financial Astrology: (no clue at all where market is heading) Technical Analysis : US indices – expect more decline. US Market: A fairly heavy schedule of potential market moving economics and earnings reports this week: Tuesday: Goldman Sach earnings Wednesday: FOMC minutes, Crude Inventories Thursday: JP Morgan Chase earnings Friday: Citigroup and BOA earnings

July Stock Market Patterns

According to Stock Traders Almanac: First half generally stronger. Market often gets creamed in second half when a bear market is in progress. Time will tell whether we are still in a bear market again. Market volatility often takes hold after July 4th. Expiration week has been a mixed bag. 7.7% Dow loss in 2002, 3.6% gain last year. Week after expiration astrocious. Dow down 7 of 11 years. So, investors are better off on the sidelines this month. According to one expert market timer: Week before July’s options expirations week tends to be negative by the time it ends. Expiration week tends to be negative, down 6 of the last 9 years. Dow lost a big 4.4% on the July options expirations day alone. Week after July expirations also tends to be negative, having been down 7 of the last 11 years. (Added July 10, 2009) For other historical patterns, visit CNBC News . There is a new section on Today in US Market History - historical stock market performance for the day. Click on the current da

Asian Investment Conference/Exhibition July 18-19 2009

Asian Investment Conference/Exhibition July 18-19 2009 An investment education fair organised by SIAS will be held at Suntec Convention Center. Free admission, no registration required. For details of seminar programme, visit AICE 2009

July 6 Weekly Update - Stock Market Forecast

July 6 Weekly Update - Stock Market Forecast Fengshui: Market likely to be volatile with opportunities for quick gains. Potential strength on 8 & 9 July, 2009. Financial Astrology: July 7 is full moon eclipse. If the stock markets can complete this downturn early this week, there is hope into mid-August. If this coming week ends like it did last week, then equity markets may be in store for some panic. Technical Analysis: US indices – might rebound then decline.

July 2009 Stock Market Forecast

July 7 to August 6, 2009 This is the Yin Metal Goat Month. There are opportunities for profits in the first half. Markets likely to be unstable and volatile in the second half. Probability of a huge correction is high due to the clash between Goat (Month) and Ox (Year). Favourable industries/sectors: Metal and Wood Financial Astrology: Equity markets may be in store for some panic. Partial lunar eclipse on July 7, 2009 (a full moon) – what effect will it have on stock markets? Watch period from July 4 to July 13, 2009. Full Solar eclipse on July 22, 2009 occurring on a new moon, longest eclipse of the century – there might be natural disasters occurring. What effect will it have on stock markets? Watch July 15 to July 29, 2009. Technical Analysis: US Market: Wave b down comprising 5 waves have started and might last a few weeks. Wave 3 down have started. When wave b down is completed, next is wave c up. Dow is in confirmed downtrend. A break of 8250 neckline confirms the Head and Sh

Trend Reversal Signal in Leader KOSPI?

Image
A very eye-opening article written by Daryl Guppy in CNBC website today. Most of which are extracted and posted below: Intermarket analysis provides an edge of safety but traders also need to be alert for changes in the market relationships. The KOSPI is the current leader, but the leadership baton will change at some time in the future, so it's important to follow the leader with your eyes open. Markets don't develop in isolation neither do they develop in unison. In any related group, there's usually a leader, and a laggard. These inter-market relationships provide good trading opportunities because one index will lead the way in behavior and development. Alert traders watch the leader, then look for a duplication of this behavior in other associated markets. These relationships allow traders to enter a new trade with greater confidence, and also to exit a trade before too much loss is incurred. The Asia region includes South Korea, Taiwan, Singapore, Hong Kong and Malays

Making of Potential Head & Shoulder Pattern?

Image
A number of US experts have been discussing about a potential bearish pattern forming in DOW and S&P500 Charts. For those who are still looking at the Elliott Wave Count mentioned in 3 Phases of Bear Market, the current wave count is a potential B Wave down of Phase 2 (ABC waves). With B wave comprising 3 waves (abc), wave a down might have completed and now we at b wave up. Nevermind if you dun understand. Let's look at the potential Head and Shoulder (H&S) Pattern forming and what it might signal going forward. Look at the DOW and S&P500 Charts. Looks like the Right Shoulder is in the process of forming. This might mean the DOW might continue to move up and down until the Right Shoulder is formed when it hits around 8250. This is the neckline of this H&S pattern. If broken, the downside target is potentially at 7,700 – this is also the P&F Chart target now. The probability of a decline is high based on the wave count – once b wave up is complete, next is wave