Dow is one of the Leaders in the Global Stock Market direction. Then who leads Dow?
If we know, it would certainly help us “manage the future” direction better. Wow, “manage the future”, not predict the future! Says who? Says Daryl Guppy!
I attended a free talk by Daryl Guppy recently. That was the best I've ever attended on how to read market directions, ie where is the market heading?
So who leads Dow? According to Daryl Guppy, who posted his analysis yesterday, watch the behaviour of NASDAQ, the leading market index in America!
Now then I know, the real “Lau Ta” (Big Brother) is Dow's “Lau Ta”, Mr NASDAQ!
Summary of key points:
1. NASDAQ index has developed new and stronger uptrend many weeks before DOW began to move.
2. The new trend in NASDAQ index is more developed than the trend in DOW.
3. Watching the NASDAQ index gives a leading indication of how the American market will develop and the way it will react when resistance levels are encountered.
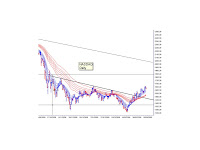
4. There are two important resistance levels for the NASDAQ index:
- The first resistance level is the historical level near 1850 to 1900. There is a high probability the market will reach this level and then develop a retreat.
- Strong resistance at level near 2100 created by the long term downtrend line.
5. The current rally is a breakout above the short term down sloping triangle pattern, but it does not mean this is the end of the bear market in America:
- In 1929, the American market fell. It was a similar degree of fall to the 2008 market fall.
- In 1930, there was a rally of more than 40% in the market.
- Then the market fell again and developed into the very severe bear market Depression of 1930.
- Rallies of between 20% and 30% developed again in 1930 and 1931 but the general direction of the market was down.
- This is the dangerous pattern that could be repeated in the NASDAQ Index and the American market in 2009.
6. The current rally breakout is very strong. A rise from 1400 to 1850 is 32%. If the market cannot breakout above resistance at 1850 then the market could retreat heavily and retest the old support level near 1400.
7. If the support level at 1400 fails then the next support level is near 900.
Hmmm... so, it pays to watch NASDAQ closely as it moves towards resistance near 1850.
Who is the other Leader in the Global Stock Market direction?
Who is the Leader in Asia?
Watch this space!


Comments